
Quick start
- Sign in with your email and password. On a phone or tablet, add the app to the home screen. More
- Pick the site and the day in the bar at the top; what is on screen follows them. More
- See the day’s trucks: Transactions, then open one for its images, ticket and PDF. More
- Find a load: Search by ticket, plate or truck, across your sites. More
- Work an alert: Alerts, open one, Claim it, then Resolve it with a comment. More
- See how your sites are doing: the Dashboard, Management. More
1. What ScaleWatcher Cloud does
Your loads on the record: the truck, its plate, its weights, its ticket and its images and video, in one transaction.
ScaleWatcher has two parts. The ScaleWatcher device at each site, a Dividia NVR or Cloud NVR, records the cameras, reads license plates, takes the scale’s weights and receives the ticket from your ticketing system. It joins them into one transaction per truck, from Facility In to Facility Out, and sends it to ScaleWatcher Cloud, the app this guide covers. The device raises an alert when something needs a look: a truck crossed the scale and no ticket came in, the max weight is over the site’s limit, or the ticket’s weight does not match the scale’s.
How a transaction is built
Each event is a timestamped signal from an LPR camera, the scale or the ticketing system. The device ties them to the truck by its license plate: a facility visit holds one or more scale transactions, and each holds its events.
One truck visit: opens on Facility In, closes on Facility Out
One facility visit → one or more scale transactions → many events
How a truck’s time is measured
Facility Time total time on site, Facility In to Facility Out
The app works the same on a phone, a tablet and a desktop, each laid out for where it is used:
- Desktop, the office: how every site is doing, reports, search.
- Tablet, the scale house: the day’s transactions at one site and their evidence.
- Phone, on the go: alerts, a transaction’s images, the site’s cameras.
2. Getting started
Sign in
Open ScaleWatcher Cloud in any browser and sign in with your Email and Password, then Submit. With a temporary password, the app asks for a new one first (New Password, Confirm Password, Submit and Login): 8 to 72 characters, not your email address.
On a phone or tablet, add the app to the home screen from the browser’s share menu to open it like an app.
The welcome
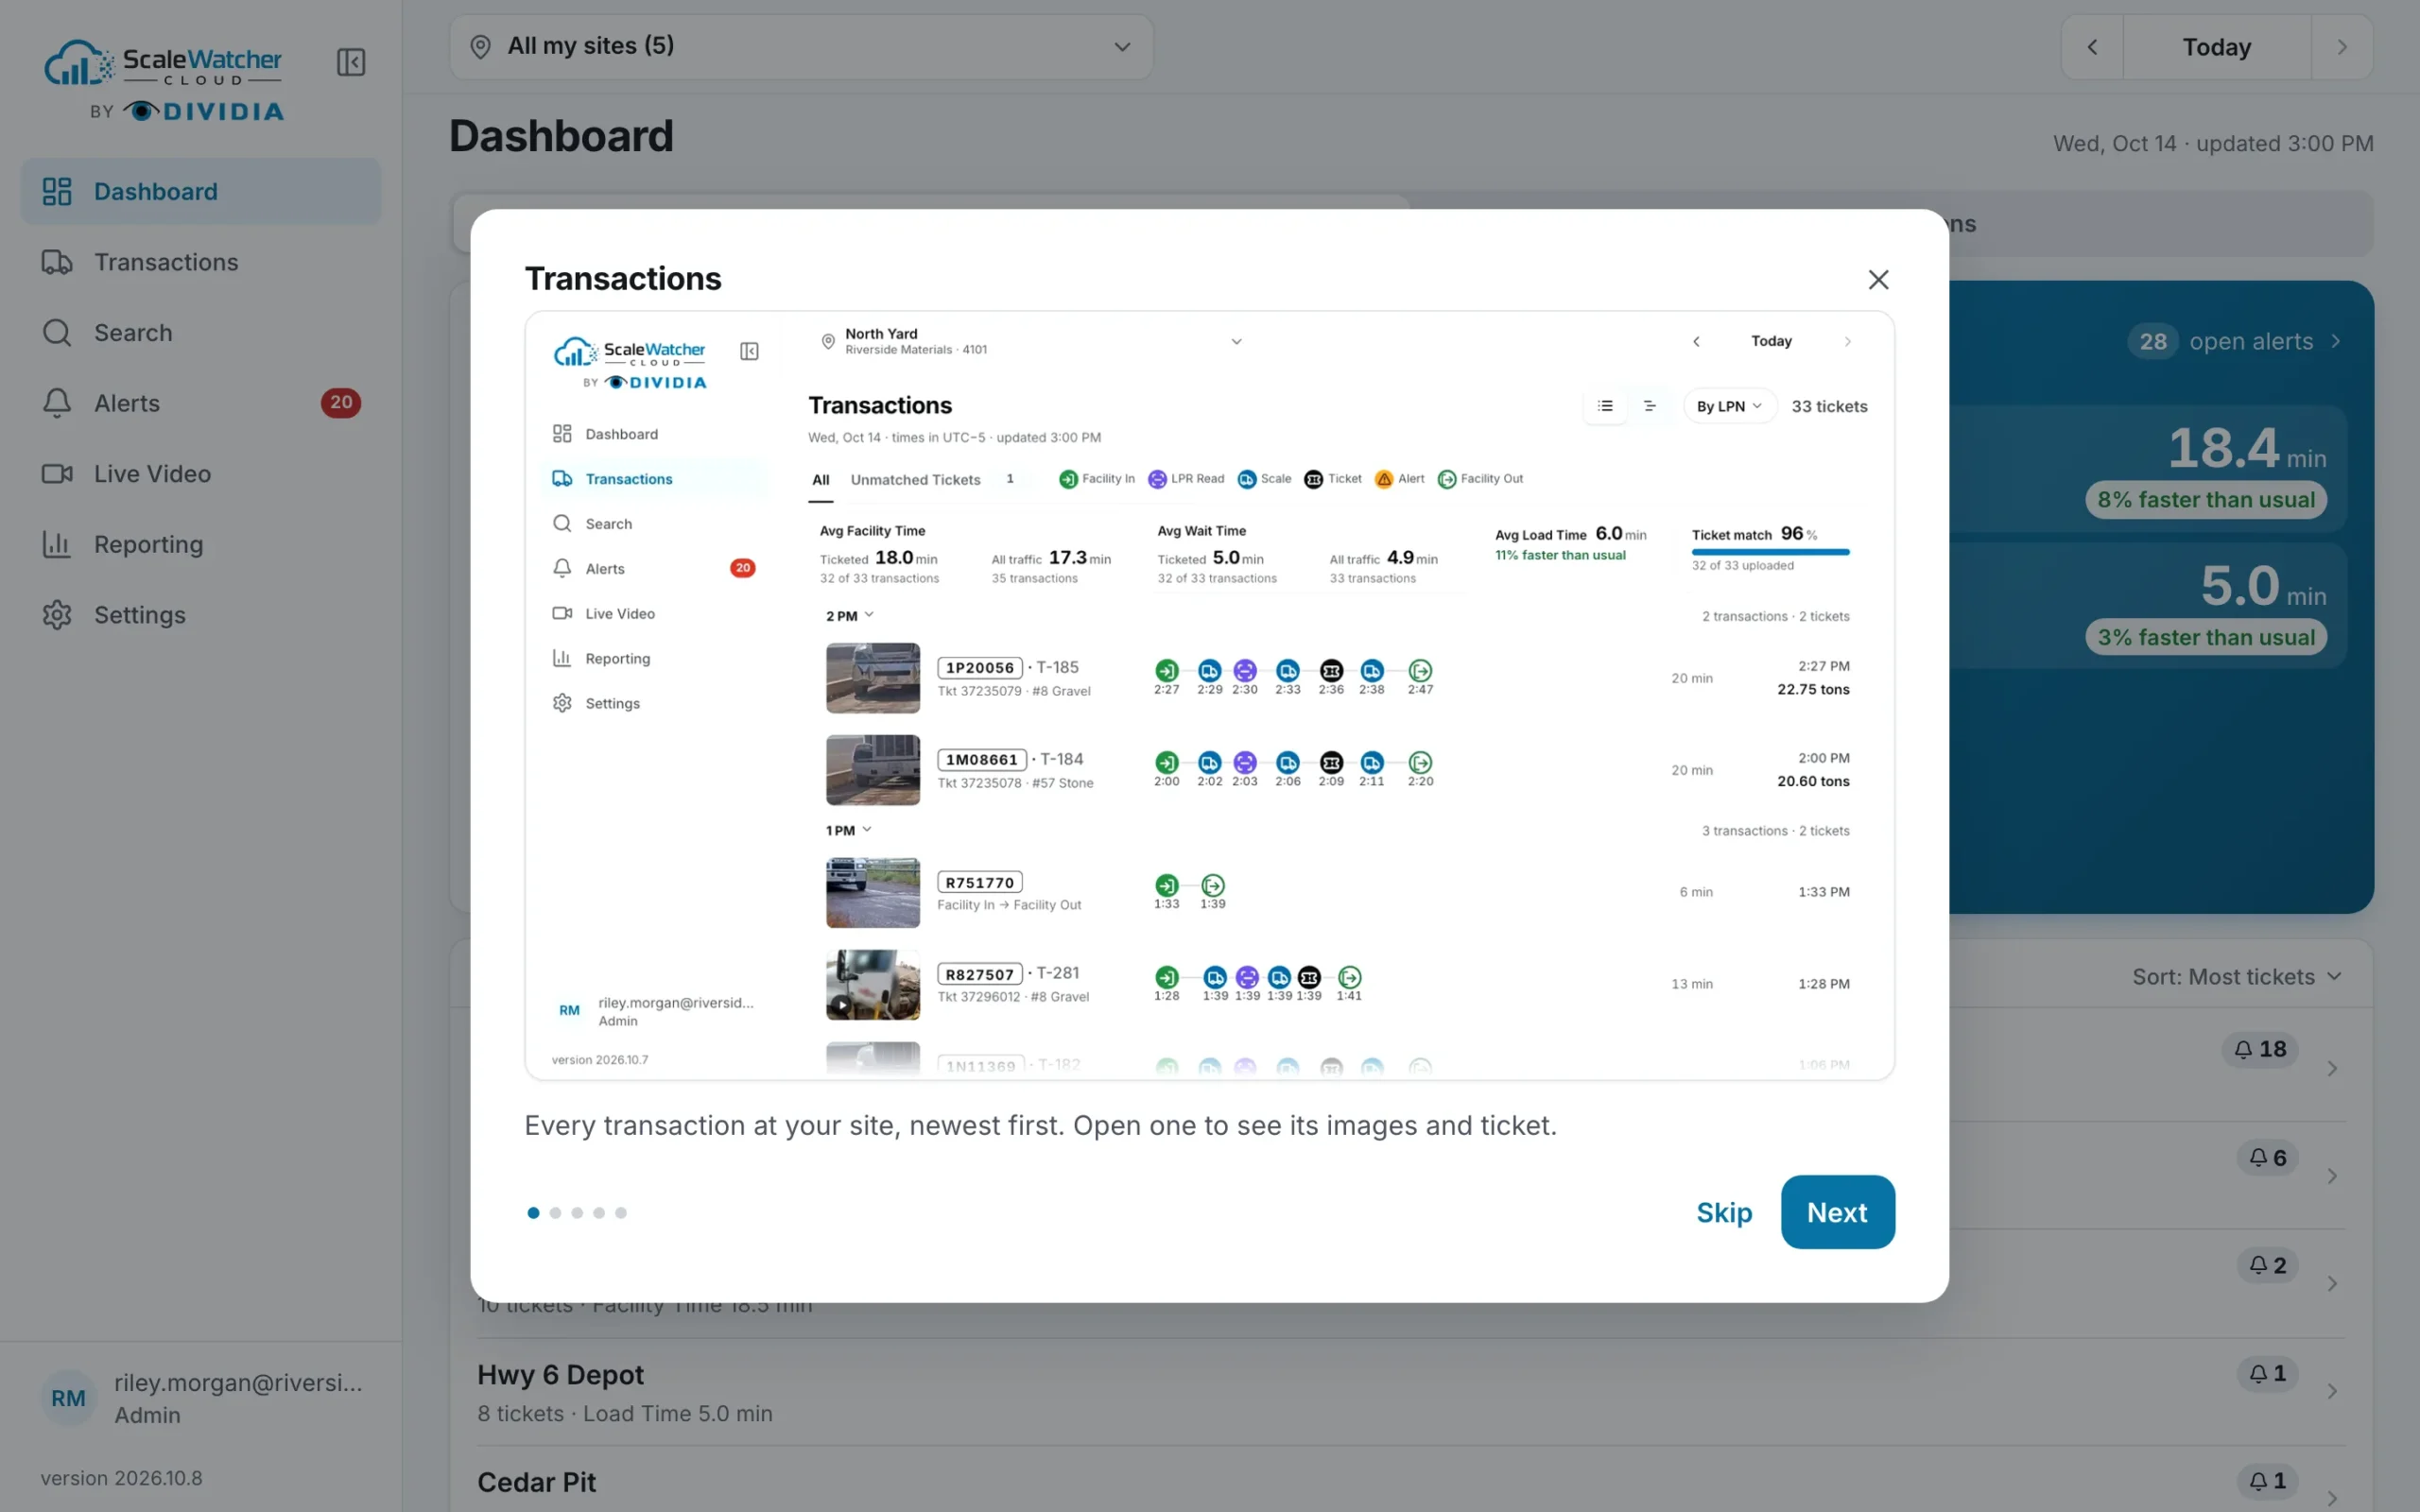
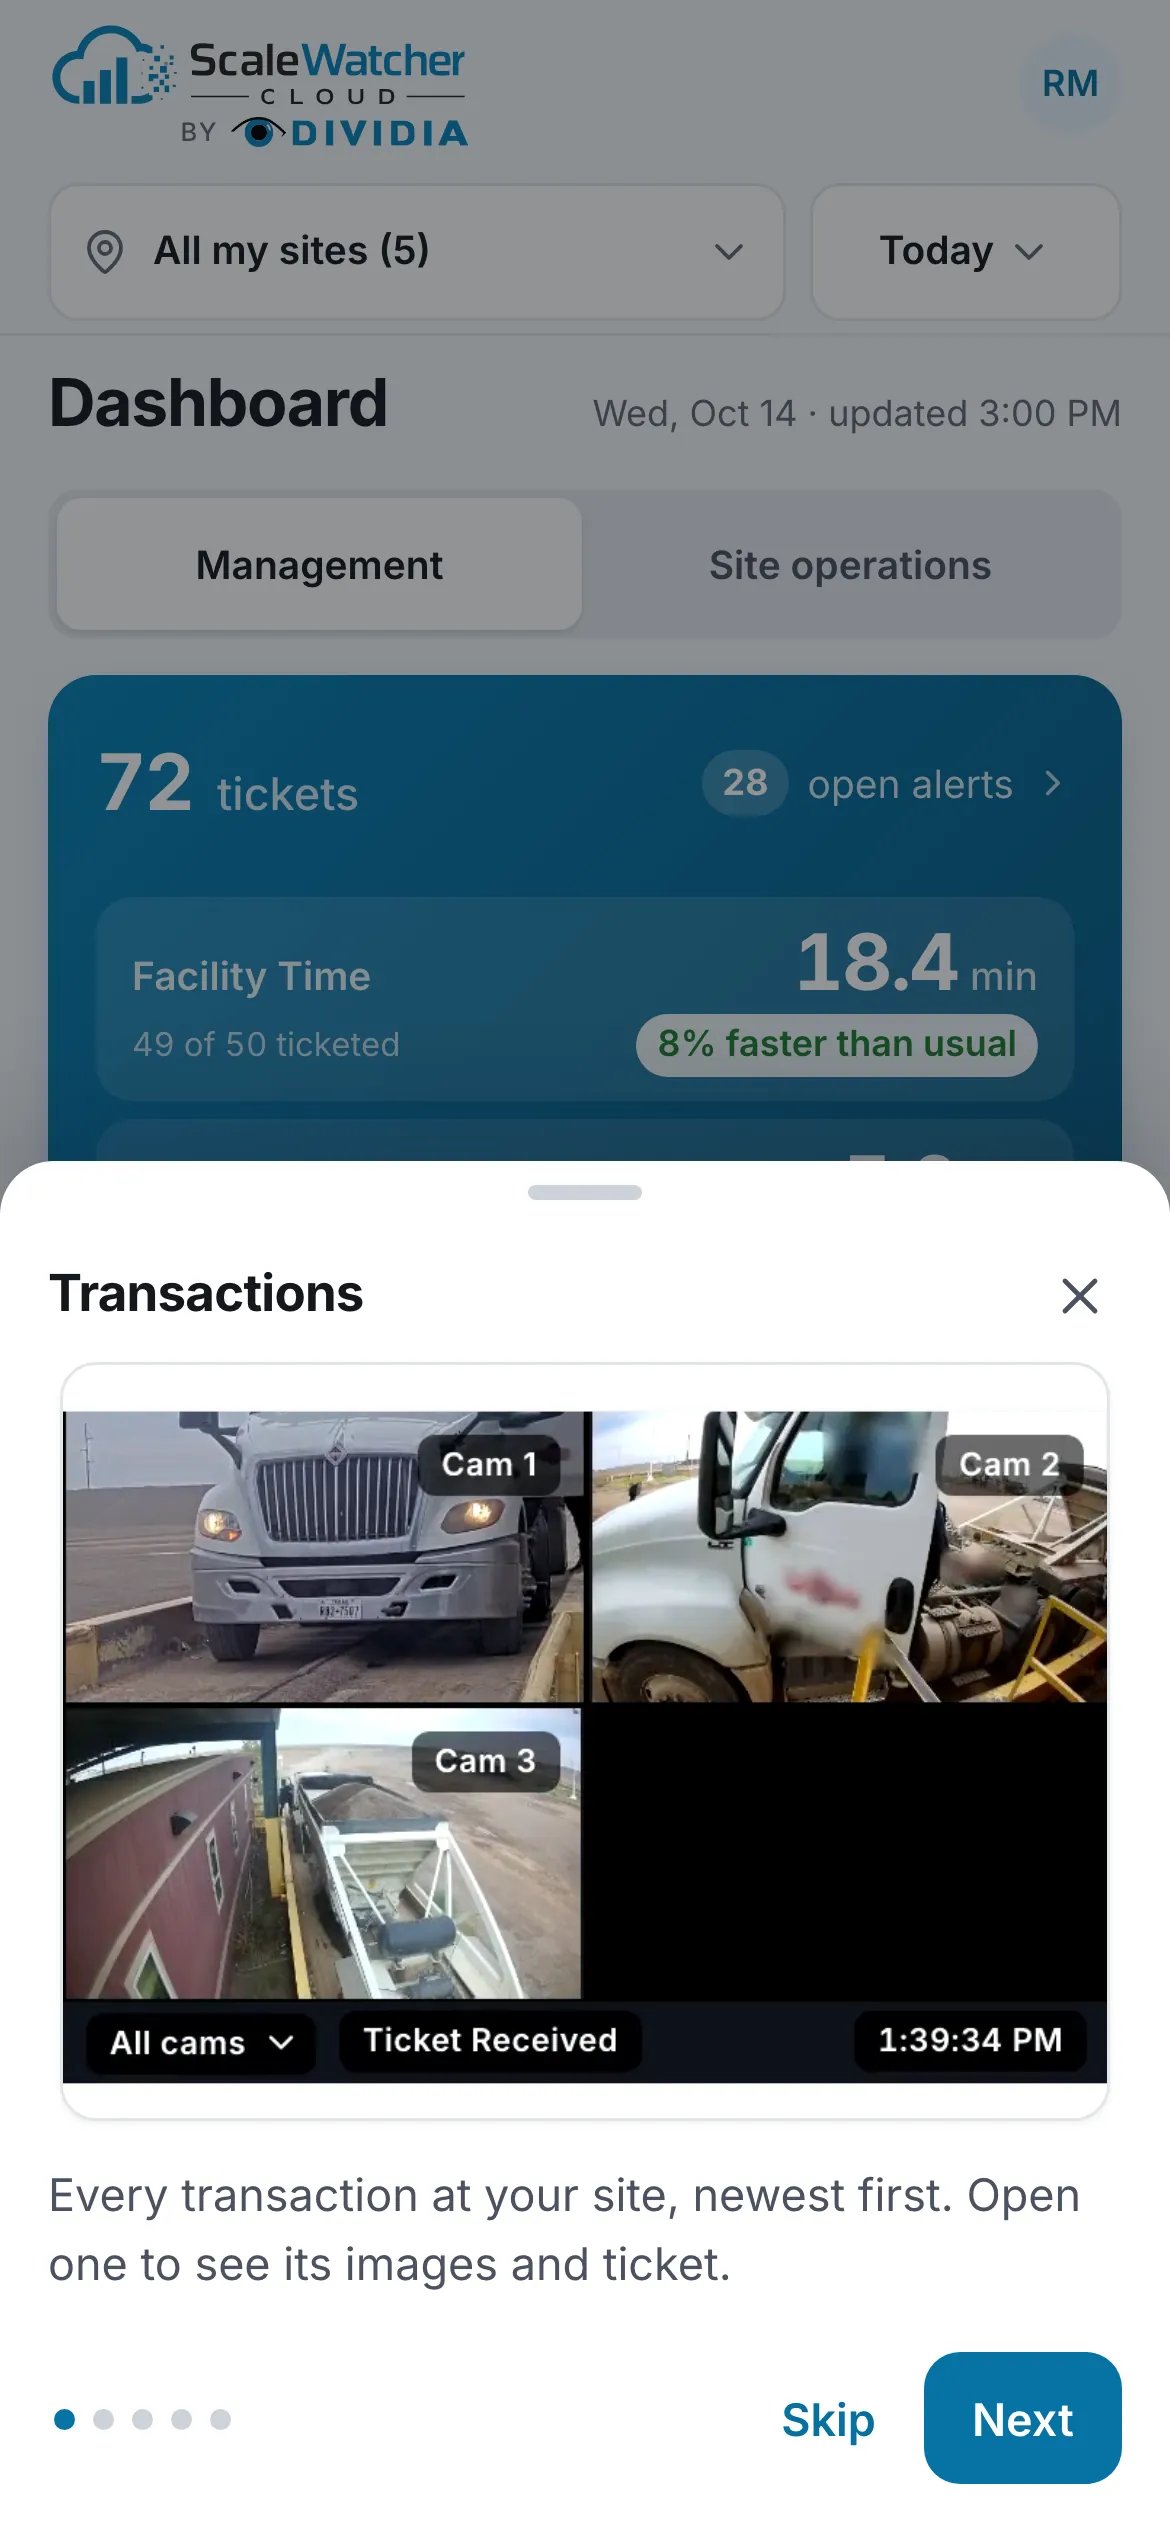
The first time you sign in on a device, a few cards introduce Transactions, Alerts and Reporting (and Live Video, if you have it), each with a short clip of the app; Next moves on. On the last card, pick the Dashboard you start on (Management or Site operations) and press Start; Skip closes it at any time. On a phone the welcome slides up from the bottom; on a tablet or a desktop it opens as a panel in the middle of the screen. To see it again: More (or the account menu), Help, Show the welcome again.
Your access
Each person sees only the sites they are given. Your role is on Account, under Your access:
| Role | What it allows |
|---|---|
| Admin | Manages your sites’ users, settings and alerts. |
| User | Sees your sites’ data and works the alerts given to you. |
| View only | Sees your sites’ data. Changes nothing. |
An extra right is listed there too: Live Video (Dividia gives it).
3. Getting around
Menus
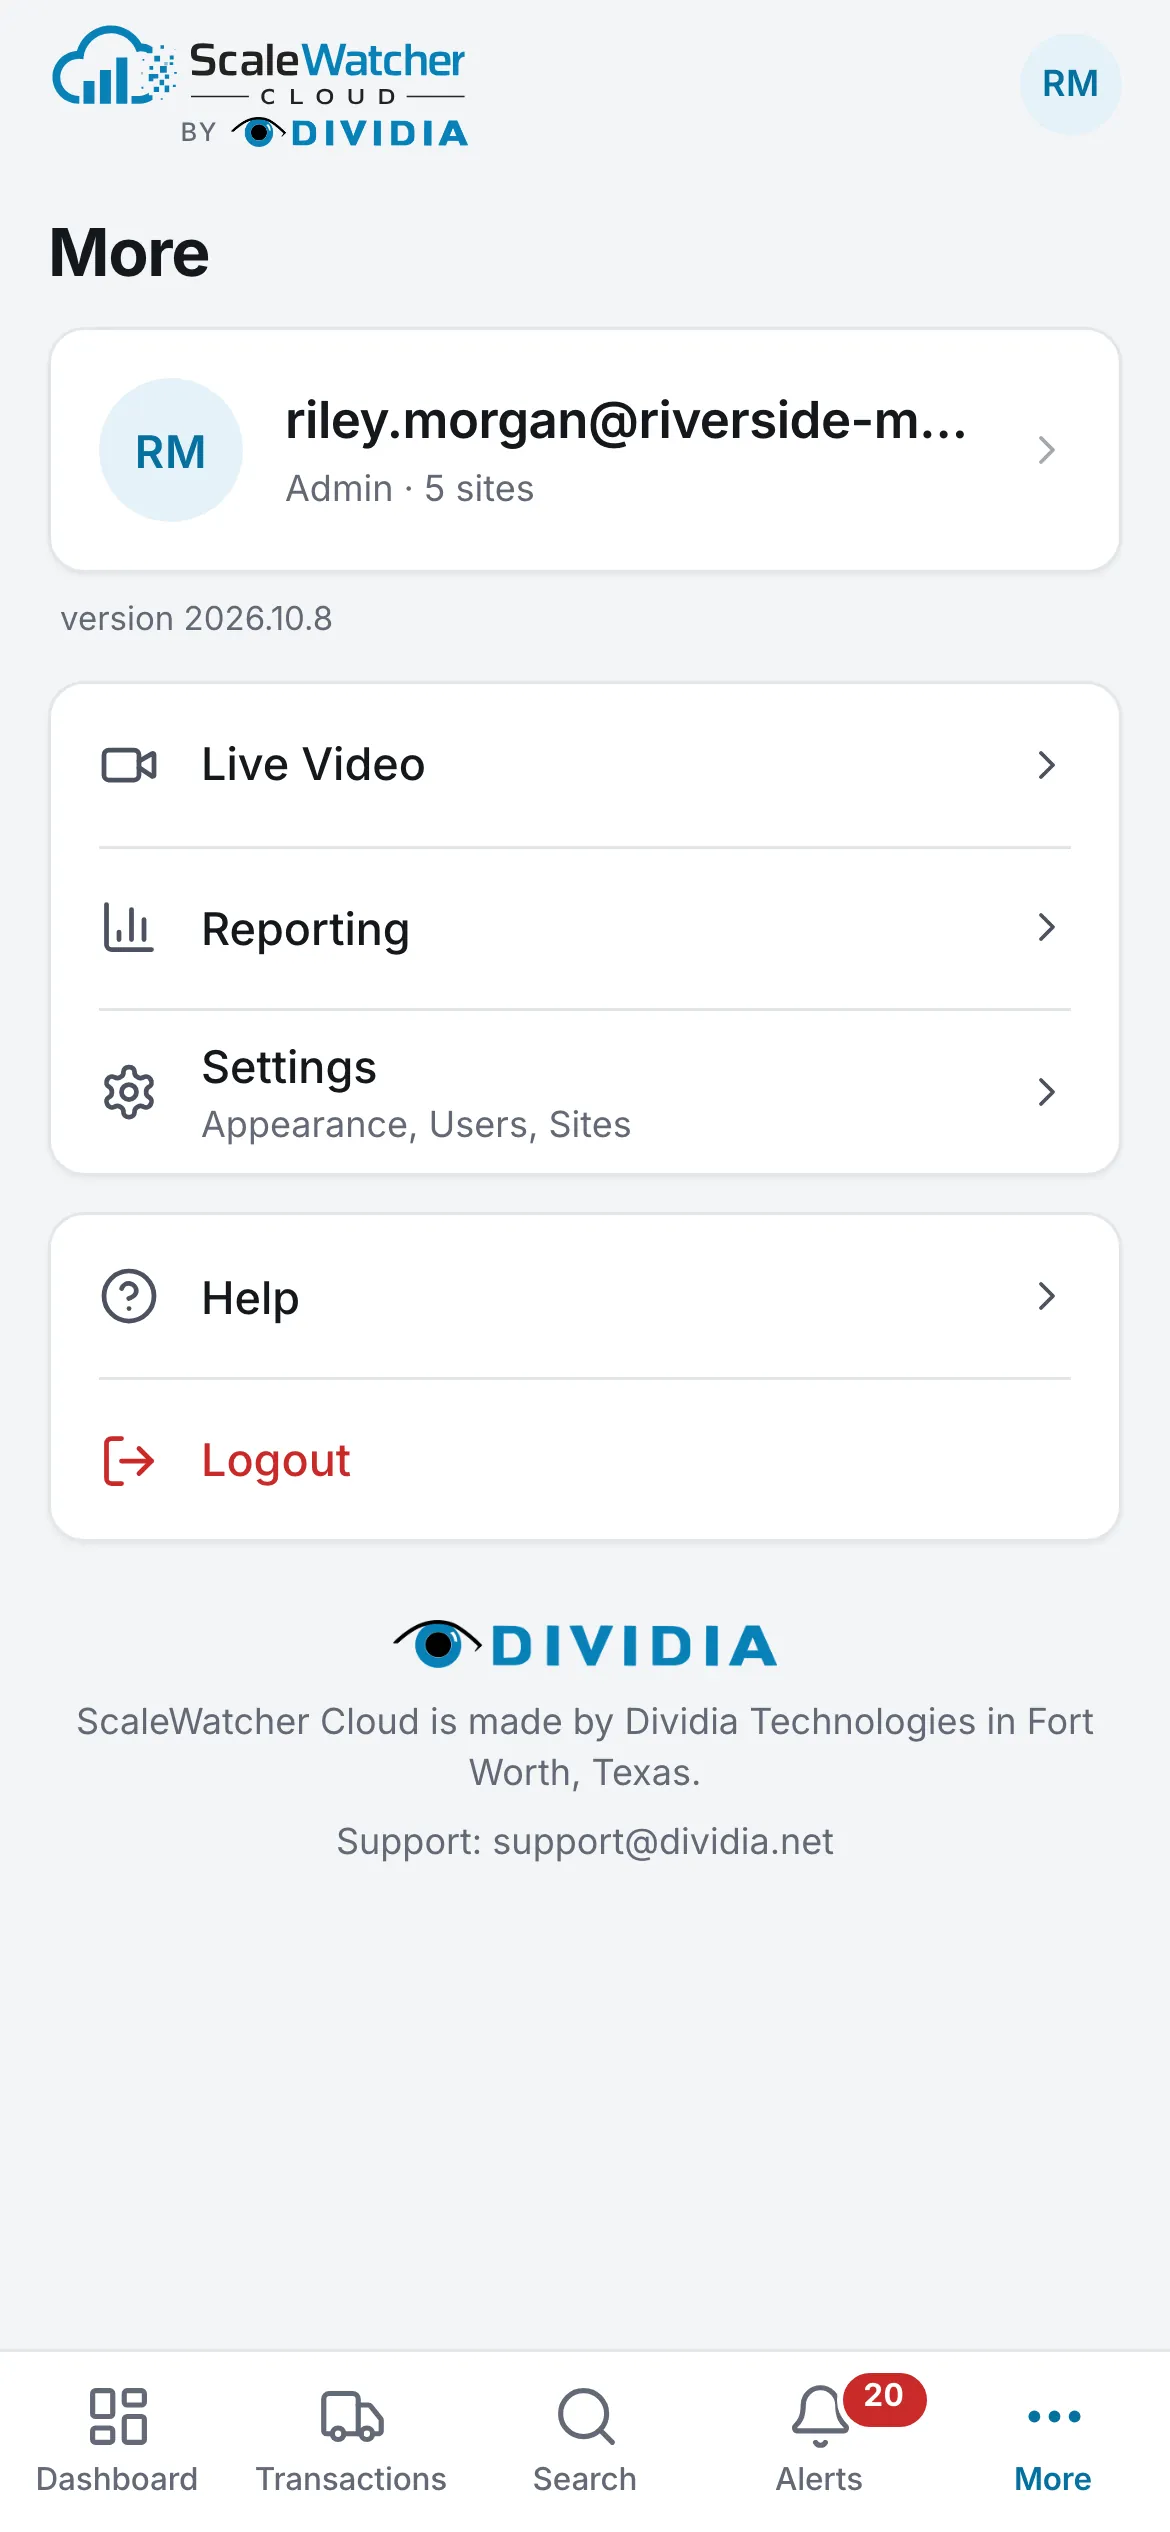
- Phones and tablets: the bar at the bottom holds Dashboard, Transactions, Search, Alerts (with the count of New alerts) and More. More holds Live Video, Reporting, Settings, Help, your account and Logout.
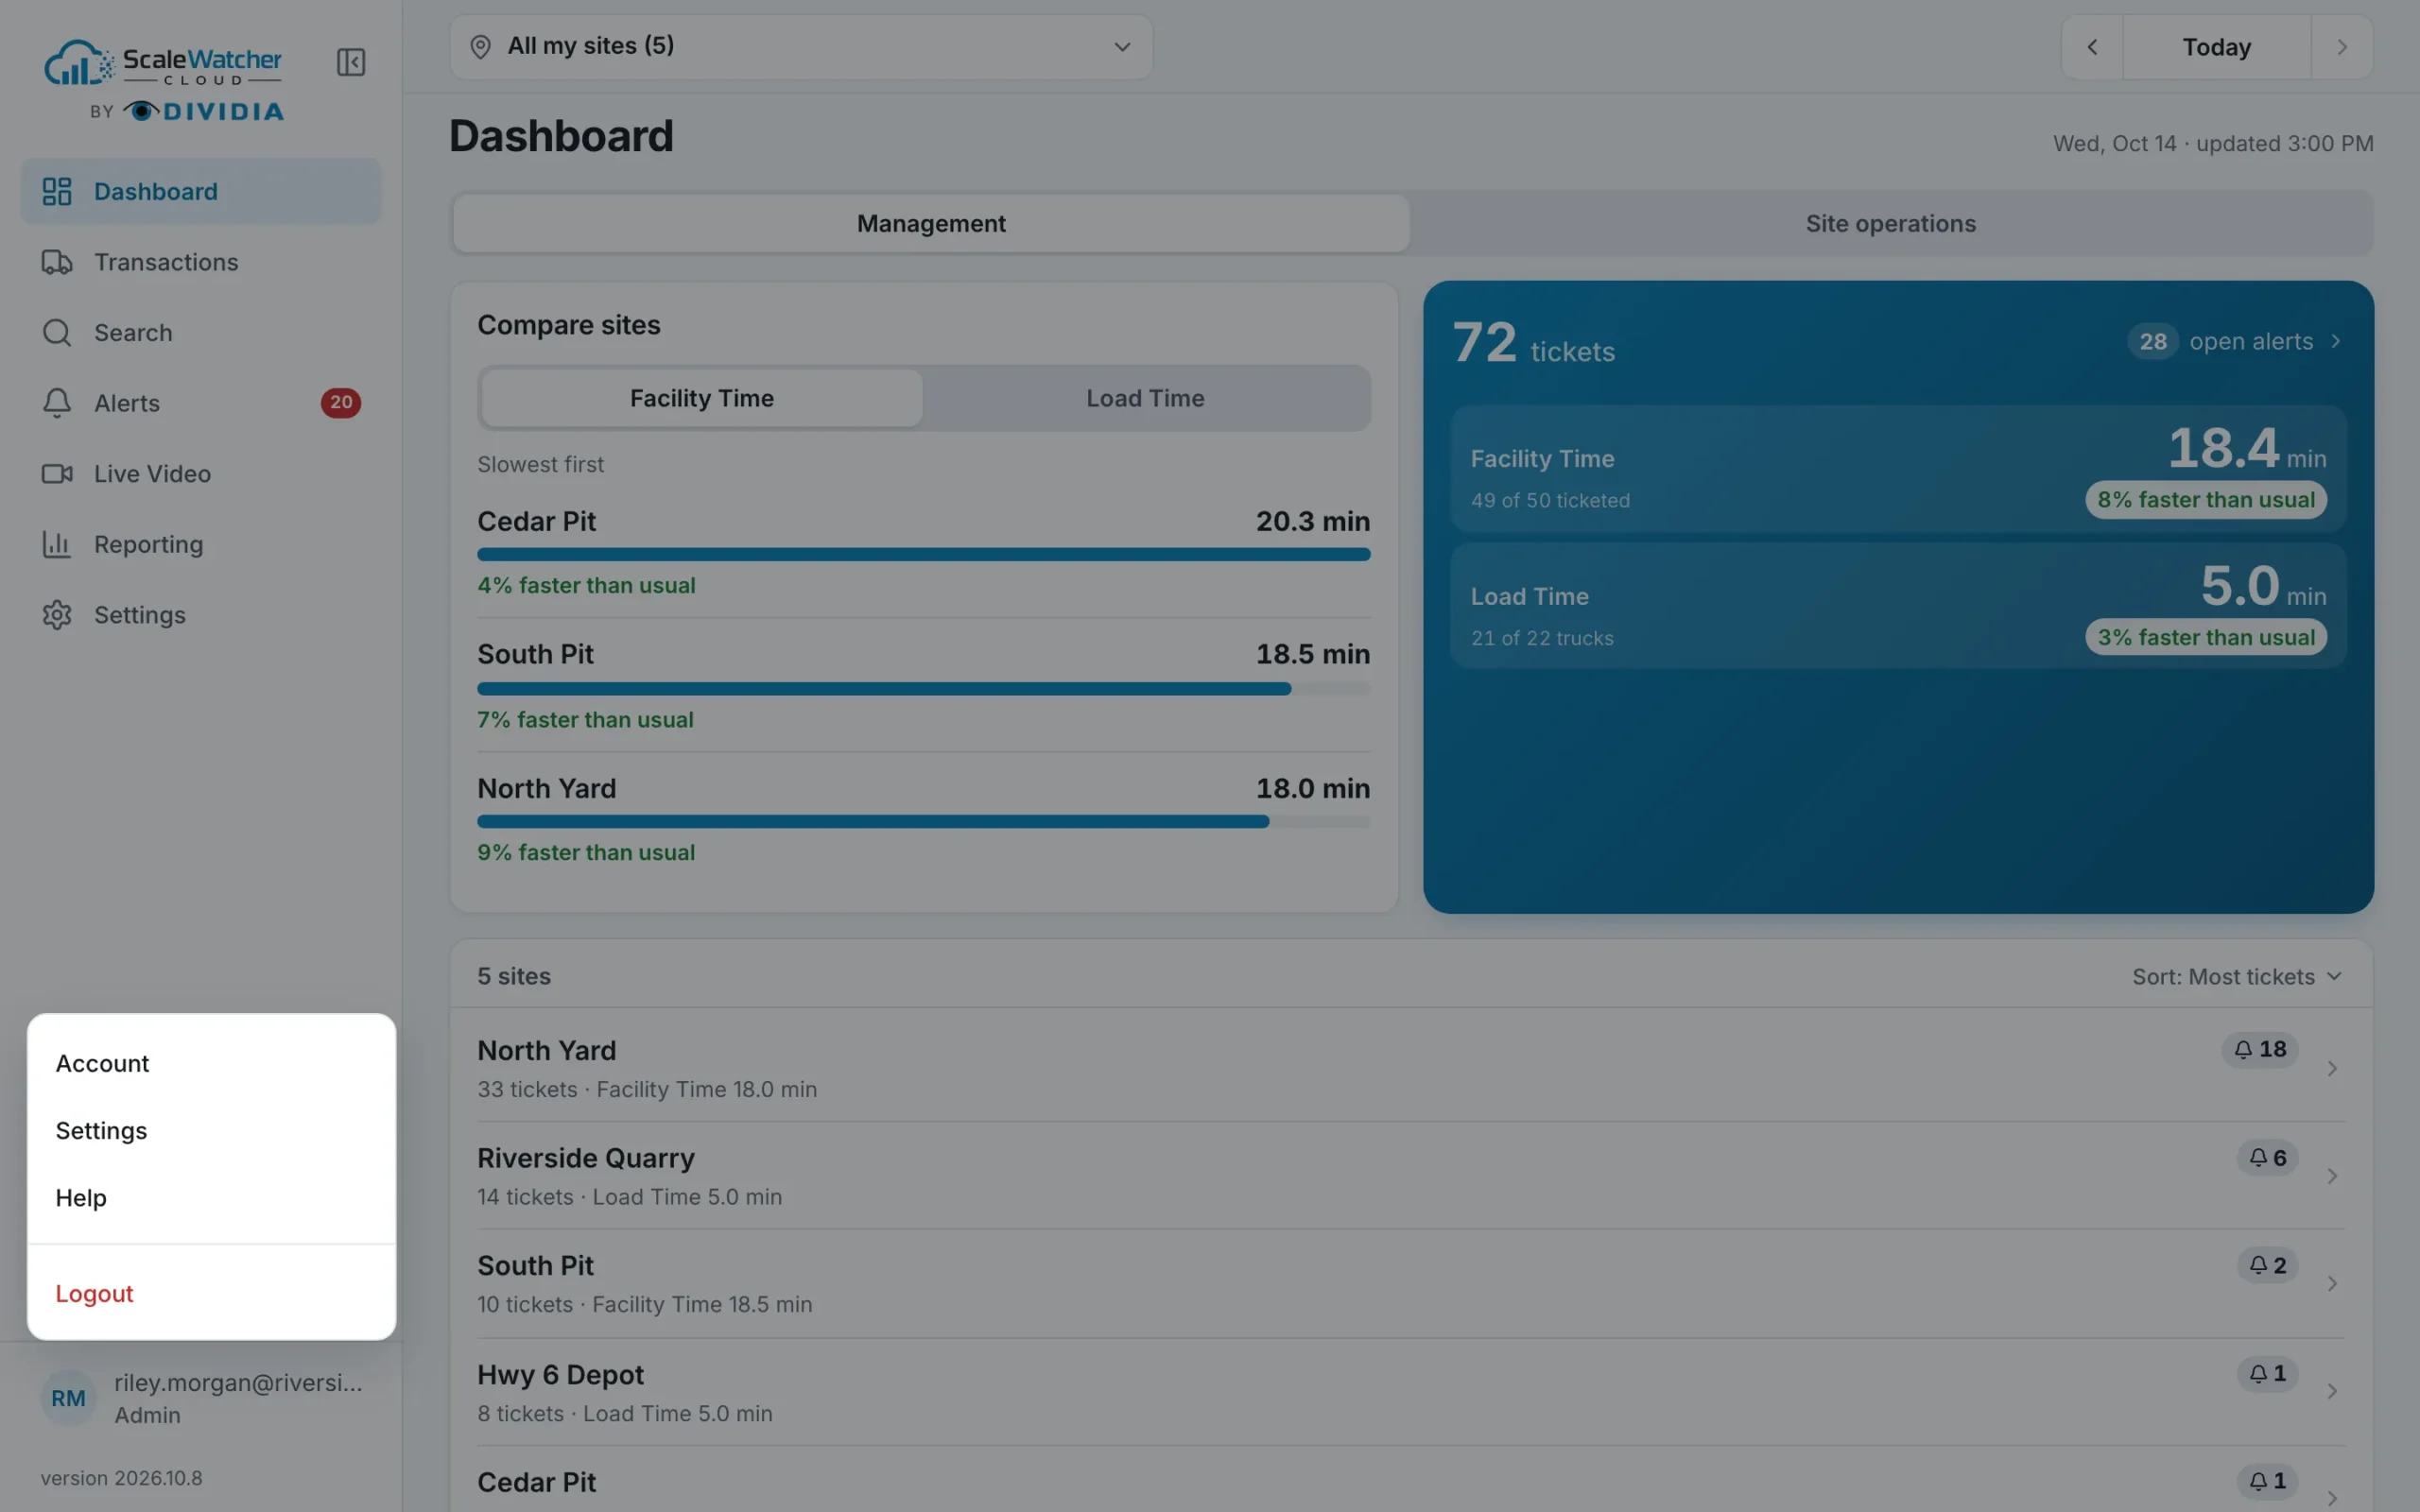
- Desktops: the menu on the left holds all seven: Dashboard, Transactions, Search, Alerts, Live Video, Reporting and Settings. Collapse menu narrows it to icons. The account button at its foot holds Account, Settings, Help and Logout.
Site and day
The bar under the top of each screen shows the site and the day on screen. Tap the site to pick another; everything on screen follows it. On the Dashboard, All my sites shows every site together. Use ‹ and › to step through days, or tap the day for Today, Yesterday or Pick a date.
Search, Reporting and Alerts take a date range: Today, Yesterday, Past 7 days, Past 30 days, Past 90 days or a Custom range (max 1 year). They can also cover several sites at once from the Sites list.
Light and dark
Settings, Appearance: Light, Dark, or System to follow the device. Each device keeps its own choice.
Messages at the top
- Update available. A new version is ready: press Reload.
- You are offline. Showing what was last loaded. The screen catches up when the connection is back.
4. Dashboard
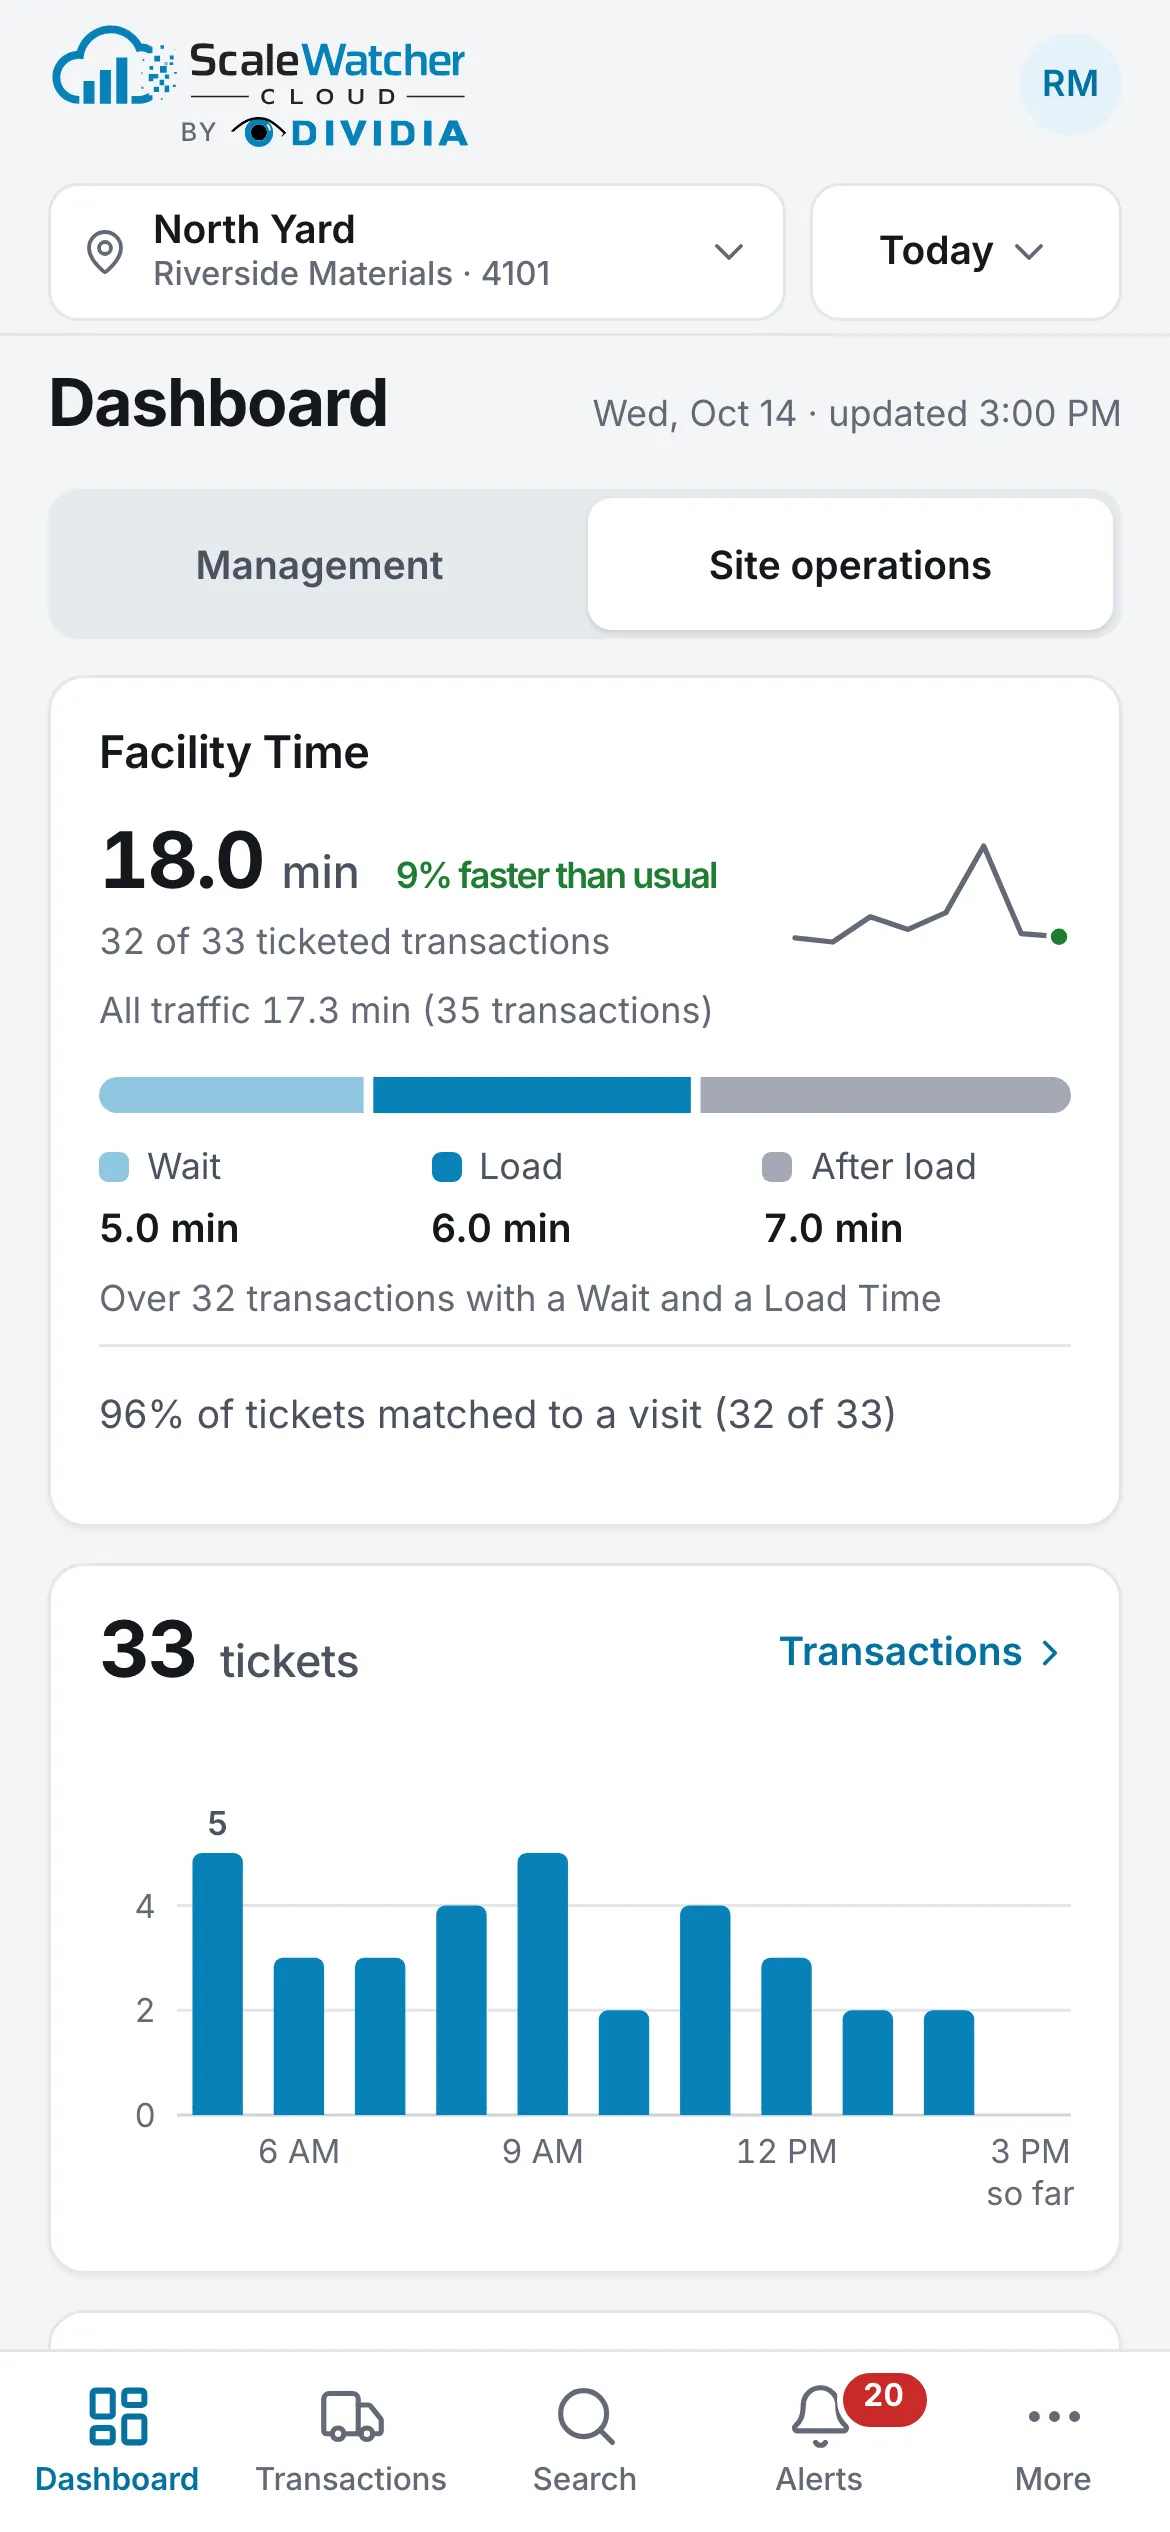
The first screen after sign-in. Two views: pick one with the switch at the top; each device keeps your pick.
| View | The question it answers | Shows |
|---|---|---|
| Management | How are my sites doing, and which one needs a look? | All your sites |
| Site operations | What needs me right now at this site? | One site |
The Dashboard refreshes every 2 minutes; on a phone or tablet, pull down to refresh at once.
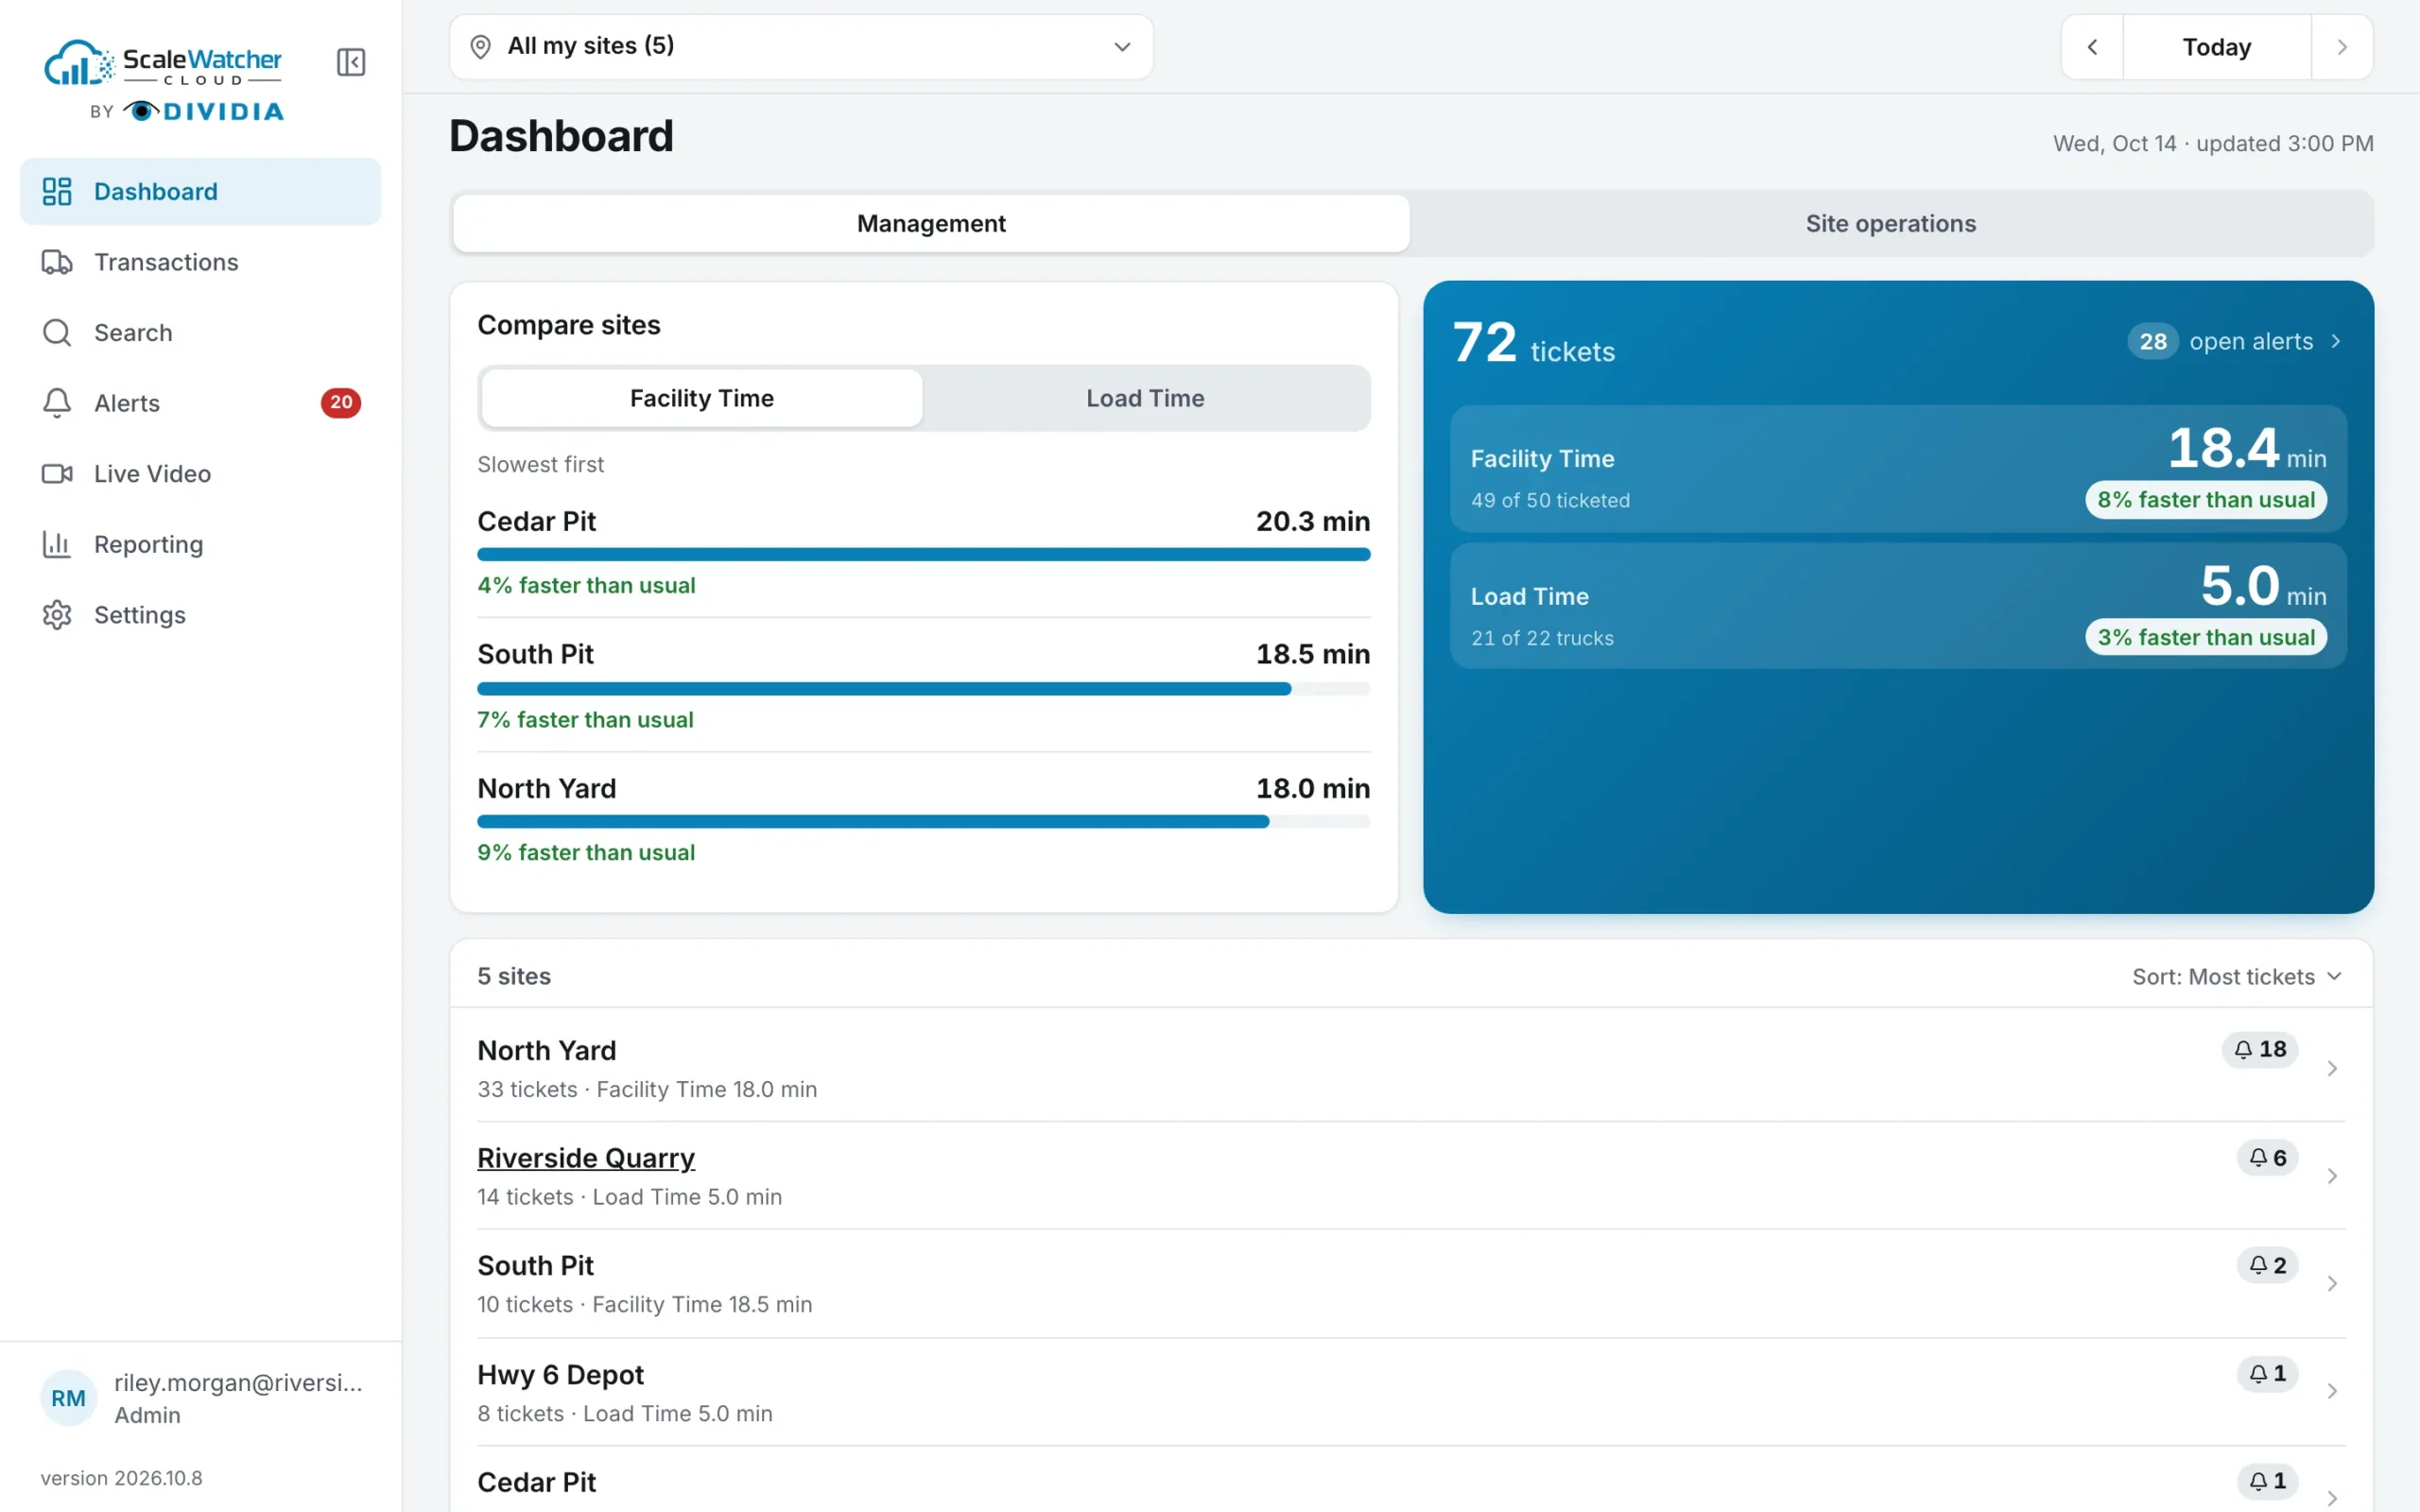
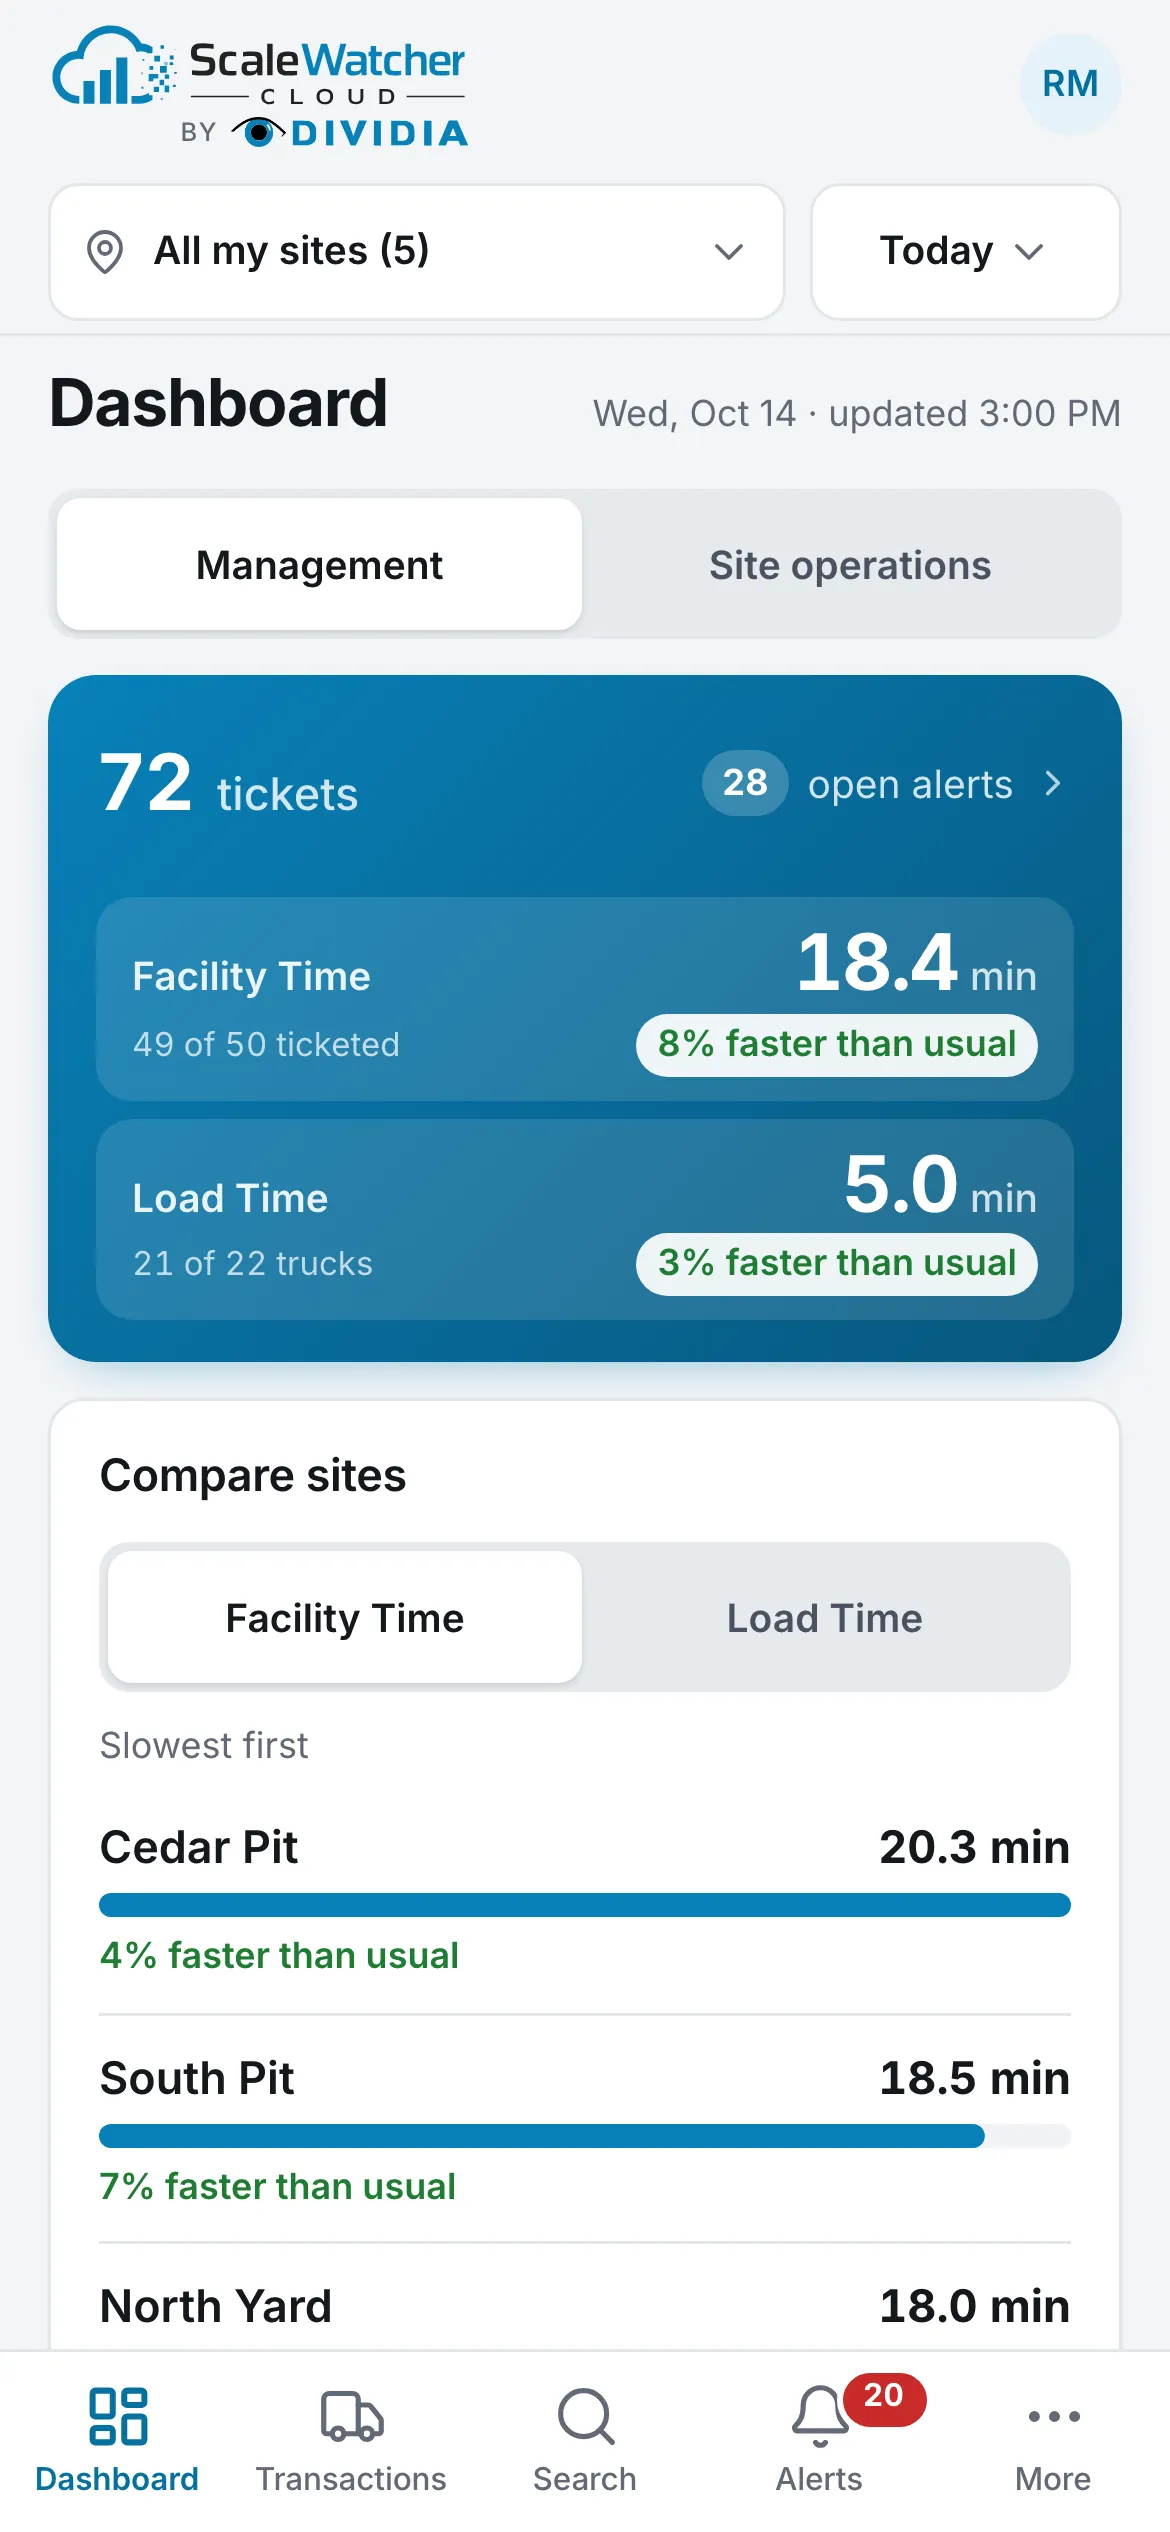
Management
- Summary: the day’s tickets across your sites and the open alerts (tap to open them in Alerts).
- Facility Time (sites with entrance and exit cameras) and Load Time (sites that track the scale): the day’s average and how it compares with the 7 days before (faster or slower).
- Compare sites: the sites slowest first, each with its minutes and how it compares with usual.
- Sites: one row per site with its open alerts, tickets and average time. Sort sites: Most tickets, Slowed down most, Sped up most.
Tap a site to open its Site operations.
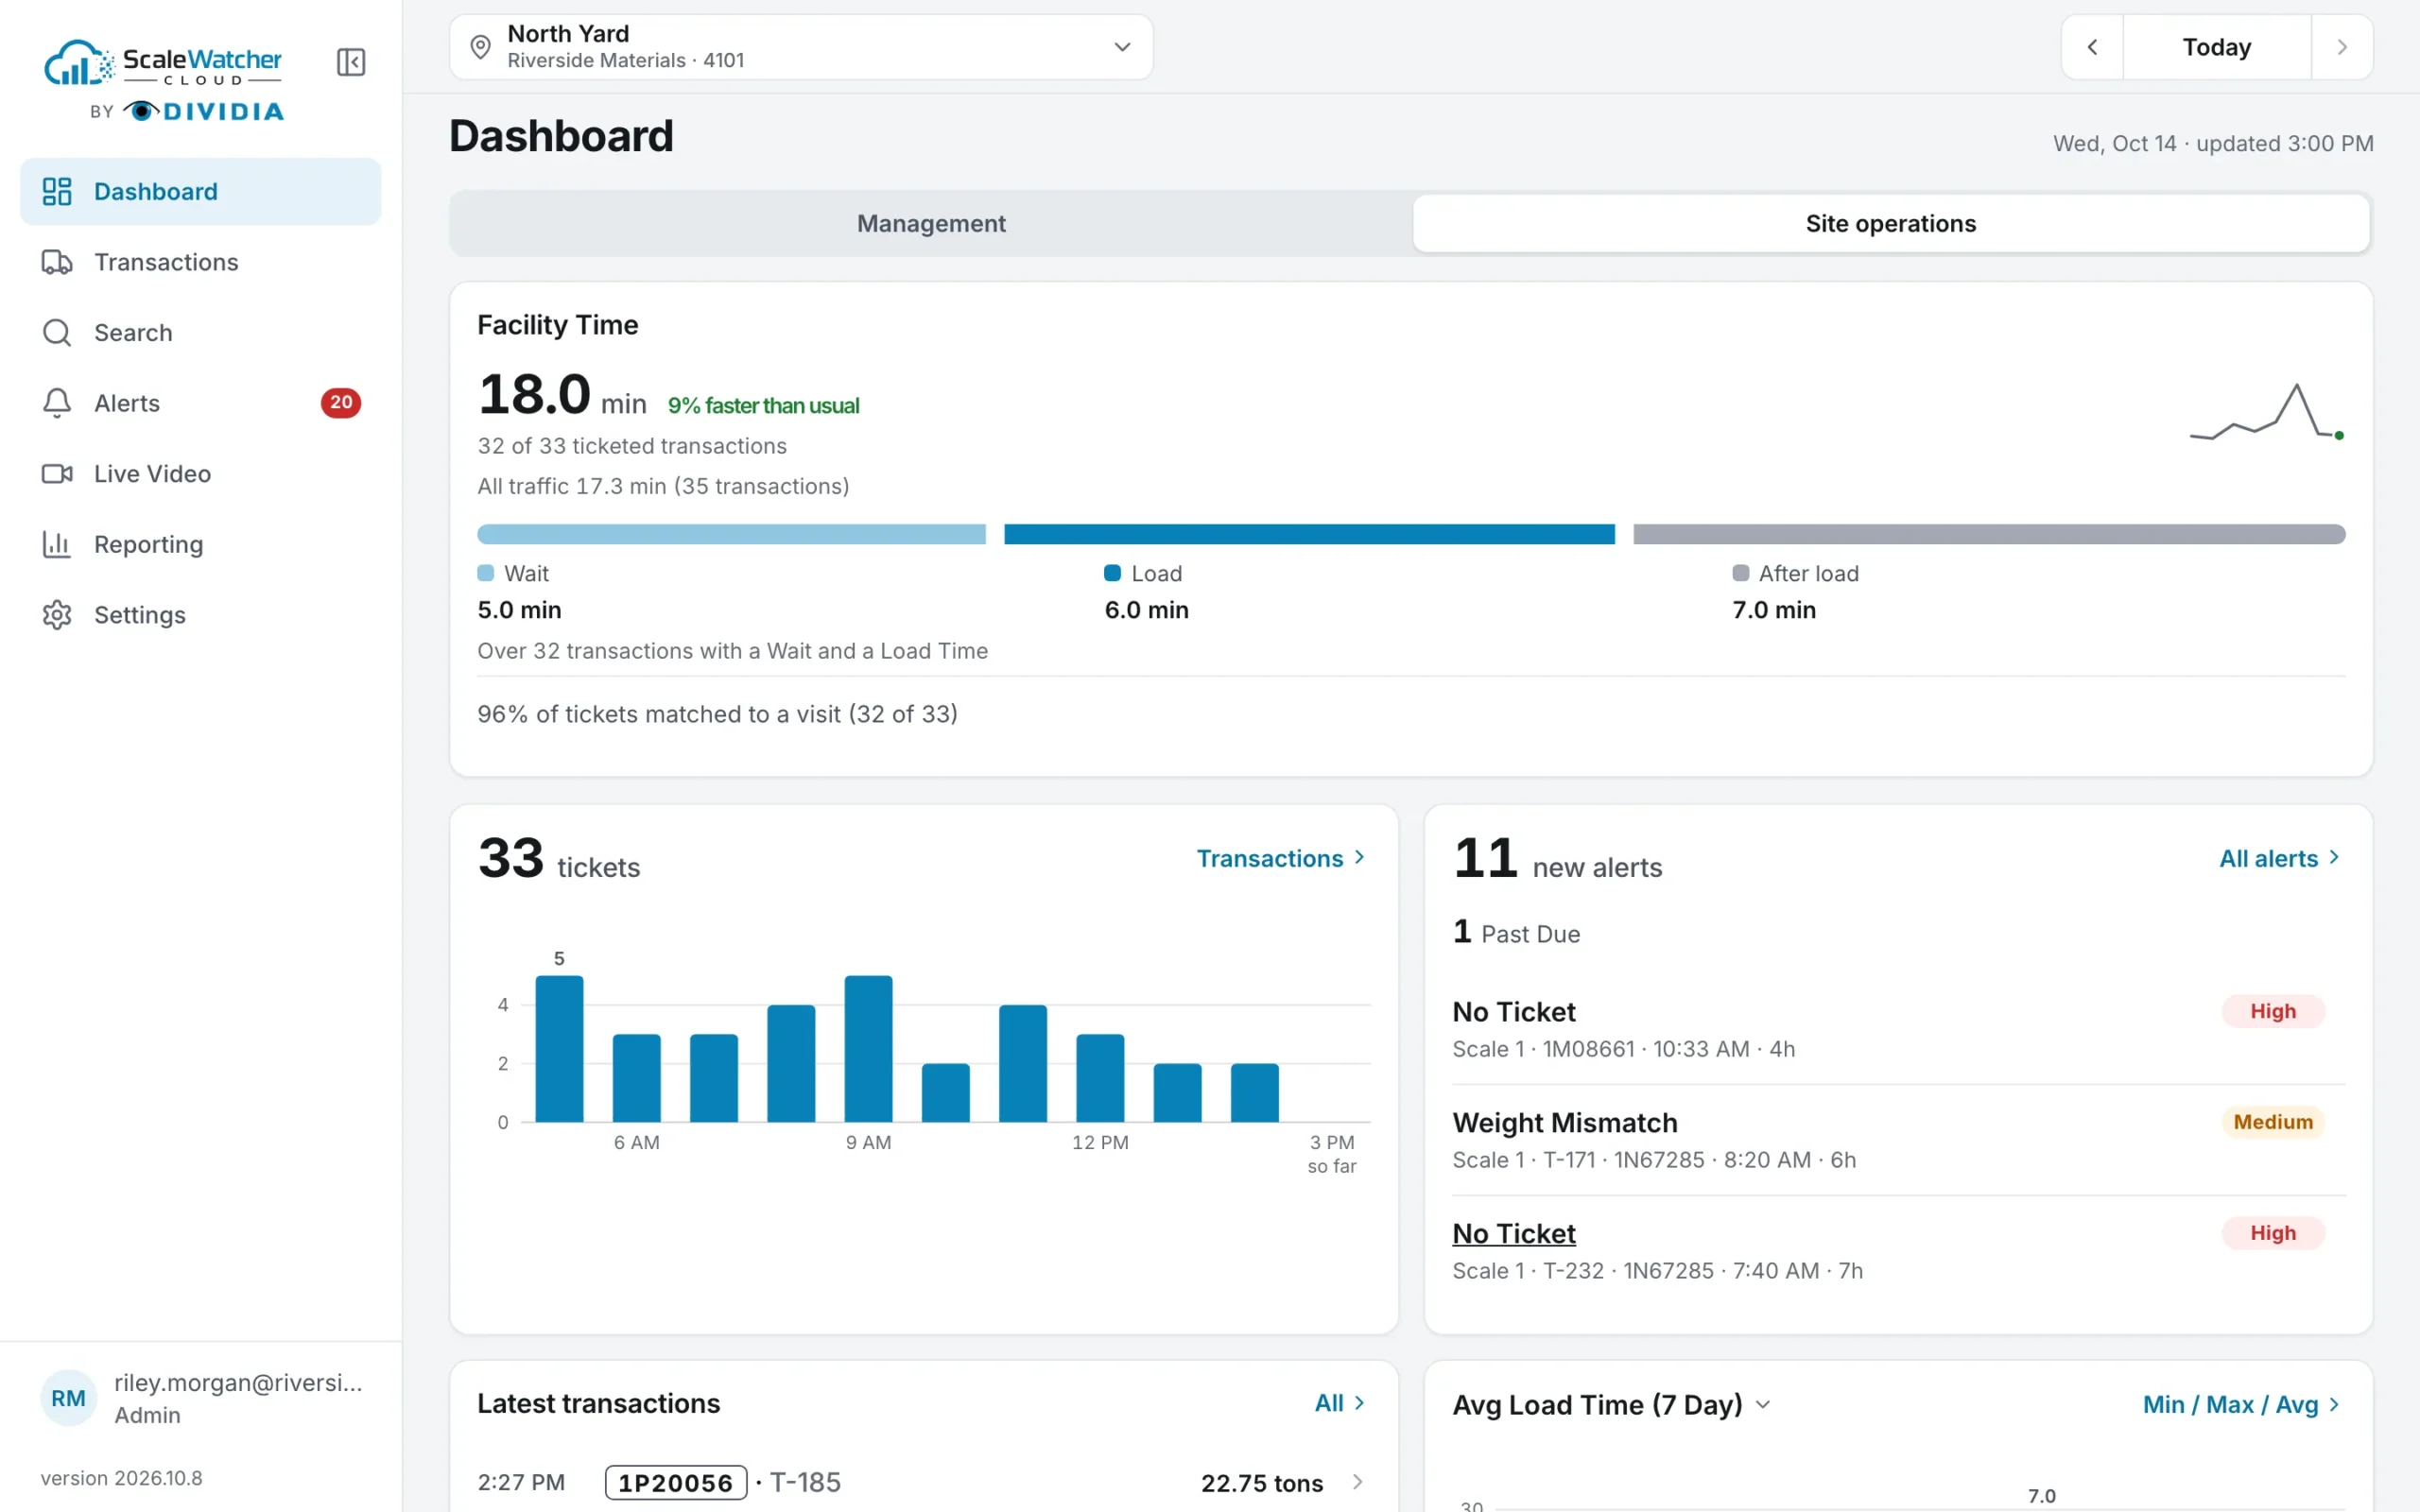
Site operations
- Performance: the site’s Facility Time or Load Time, its change from the 7 days before and its 8-day trend. Facility sites also show where the time goes (Wait, Load, After load) and Ticket match: the share of tickets matched to a truck’s visit.
- Tickets: the day’s tickets by hour. Tap an hour to see its transactions.
- Alerts: the New alerts, with Past Due and My Tasks counts. All alerts opens Alerts.
- Live Video: at sites whose NVR supports it, for people with the Live Video right: tap Start live video. Nothing plays, and no data is used, until you tap it.
- Latest transactions: the three newest; All opens Transactions.
- The last 7 days (tablets and desktops): a chart you pick per site.
On tablets and desktops, tapping a count (Past Due, My Tasks) or the main time opens its records in a side panel, without leaving the Dashboard.
5. Transactions
Every transaction at the site on the day picked, newest first.
Tabs
- All: every transaction of the day.
- Unmatched Tickets (facility sites): tickets whose transaction is uploaded but not complete. When the LPNs match exactly, they are joined automatically.
List and Timeline
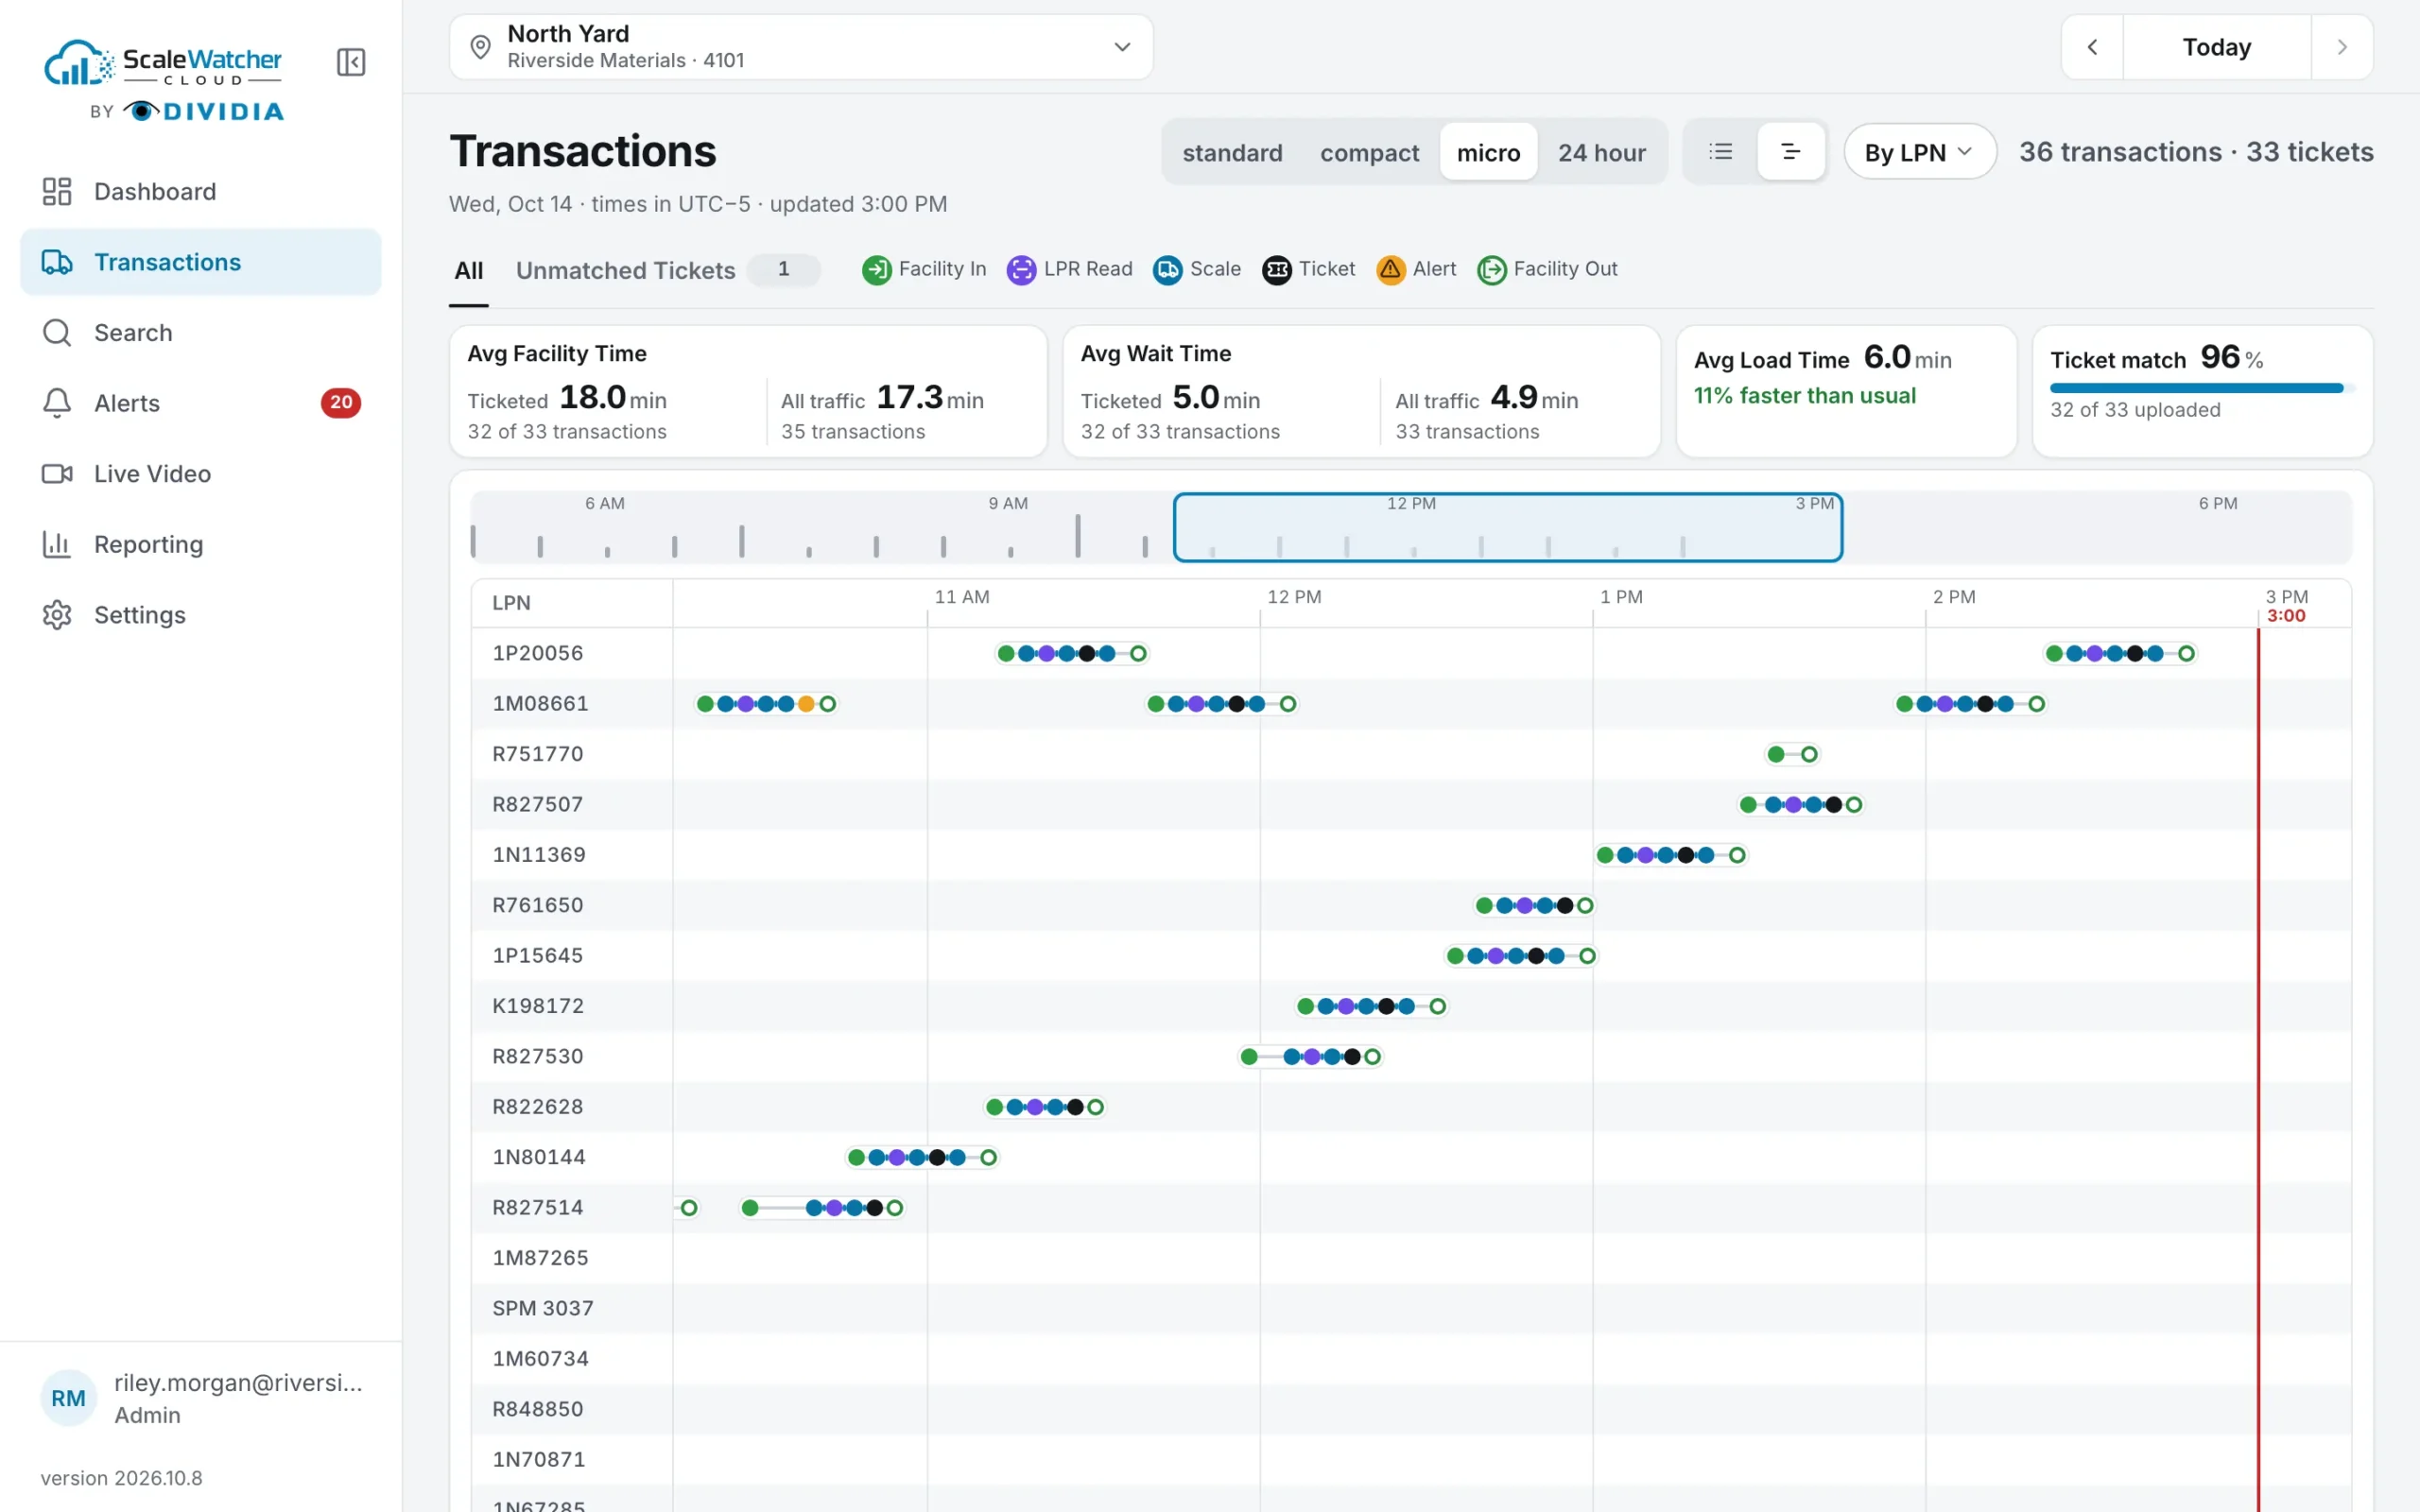
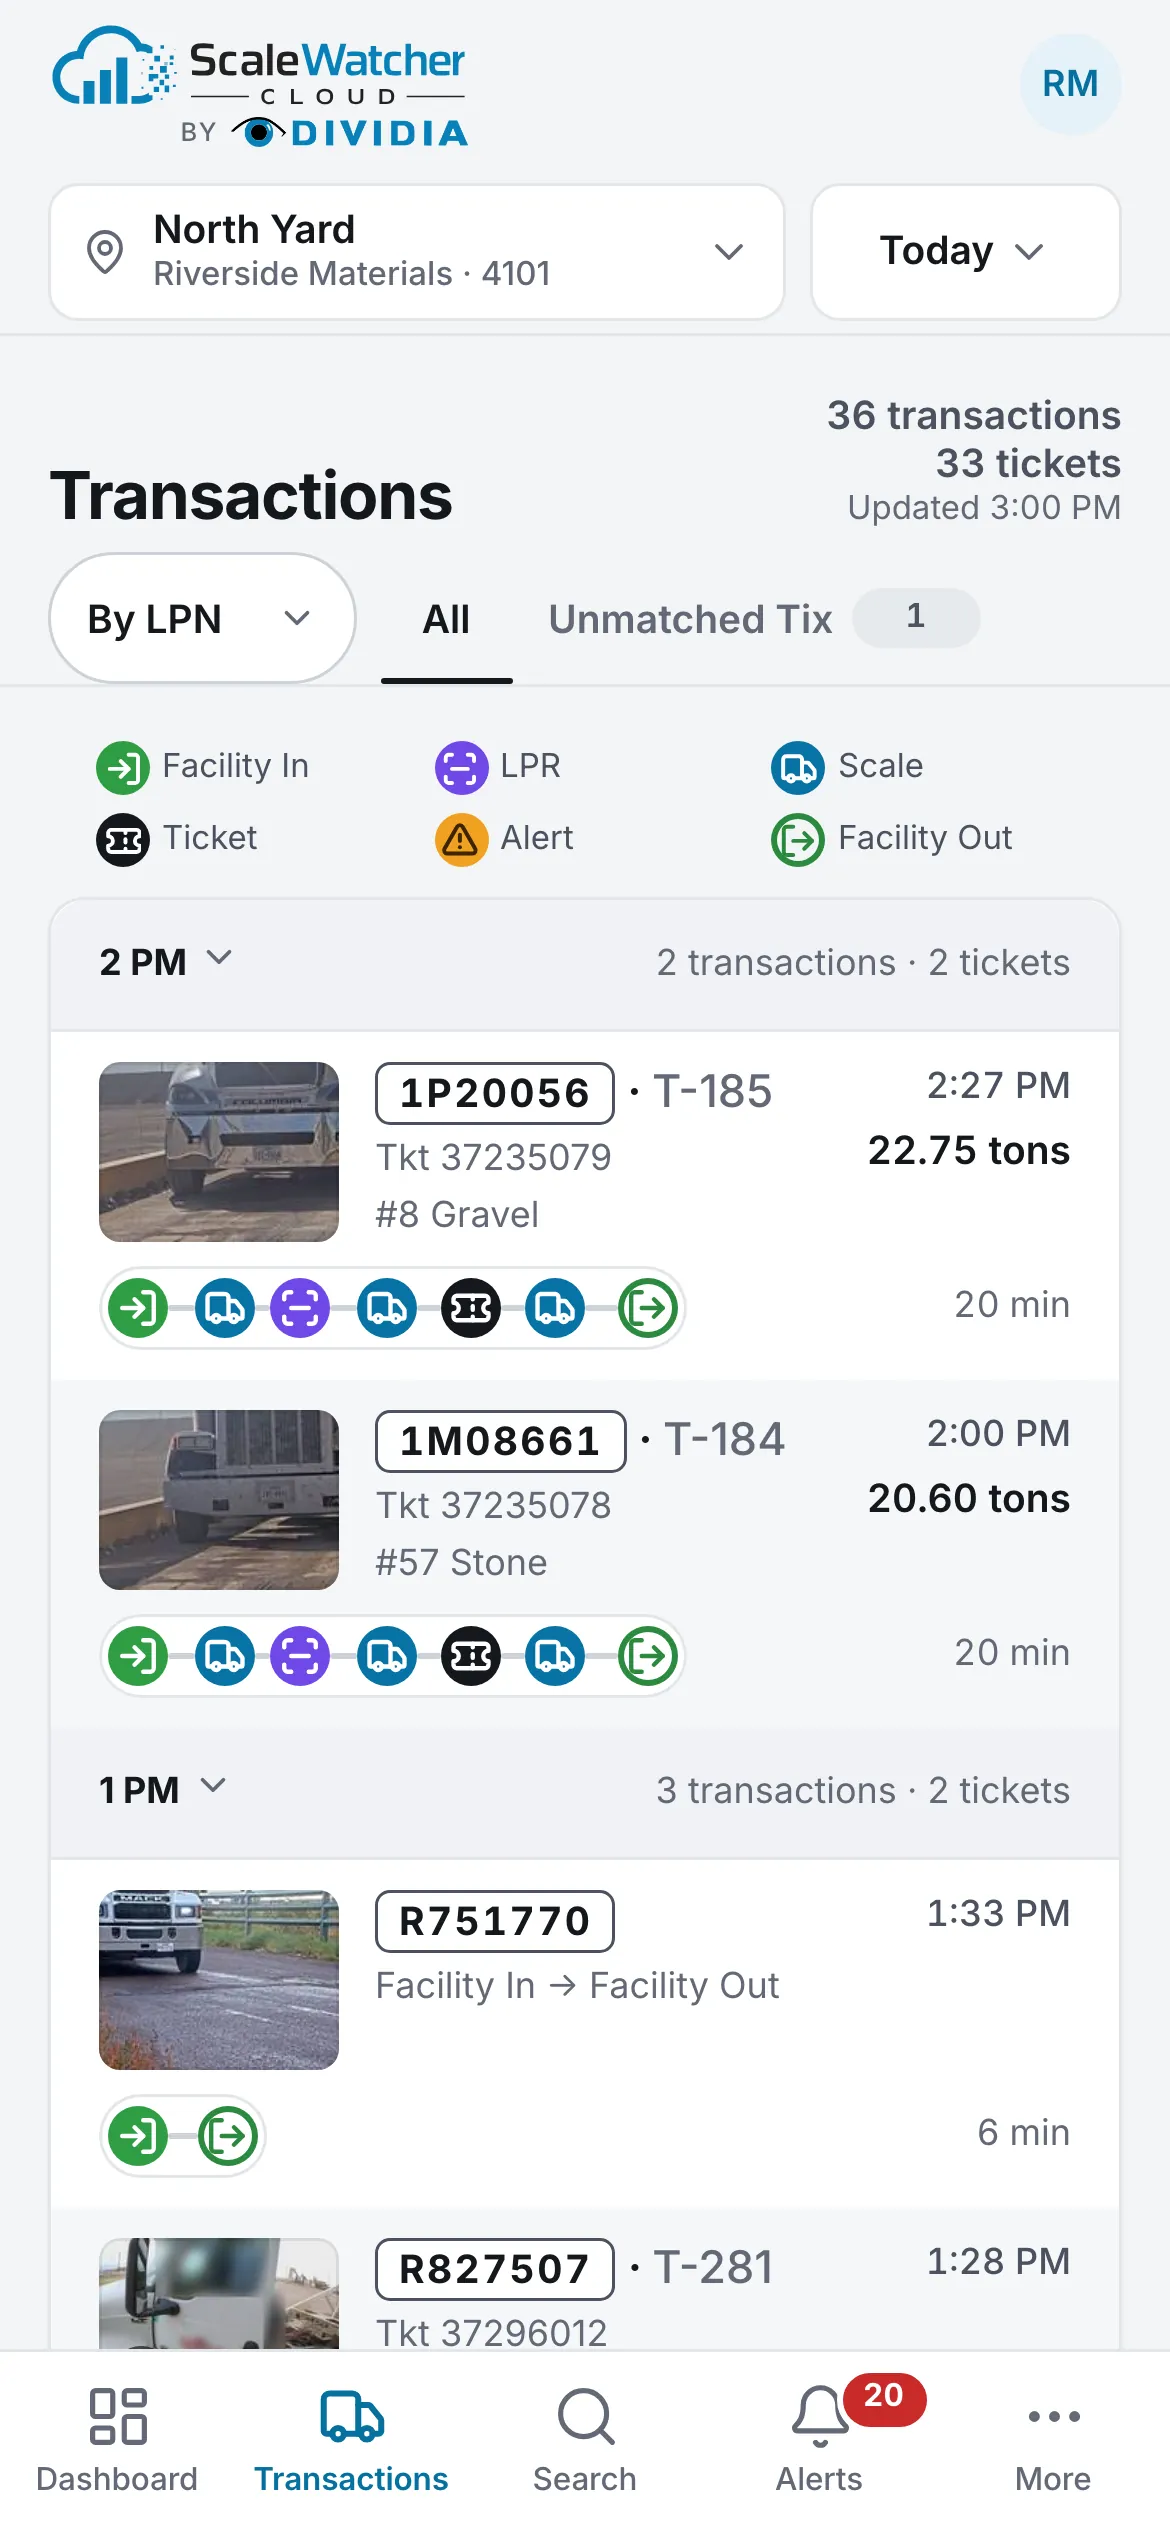
The List groups the day under hour headers; tap an hour header to jump to another hour. On tablets and desktops, the Timeline shows the day as bars on a time line, one per transaction, from its first event to its last; Zoom sets how much of the day fits (24 hour shows it all). Phones show the List.
The heading counts the day’s transactions and tickets (for example, 36 transactions · 33 tickets).
Rows lead with the Truck, the LPN or the Ticket: tap the chip (for example, By LPN) to switch. Ticket lists only the transactions with a ticket.
A row
- An image of the truck (tap to enlarge), the truck or LPN, and the arrival time.
- The ticket and product, the scale, and the tons.
- The events as one badge (tap it to see each event and its time), the alerts in amber (tap one to open it), and the transaction’s Facility Time or Load Time.
Event Key explains the badge’s colors. Tap a row to open its Transaction Evidence.
On tablets and desktops the average tiles sit above the list (Avg Facility Time, Avg Wait Time, Avg Load Time, Ticket match); a tile lists the transactions behind it, longest first.
6. Transaction Evidence
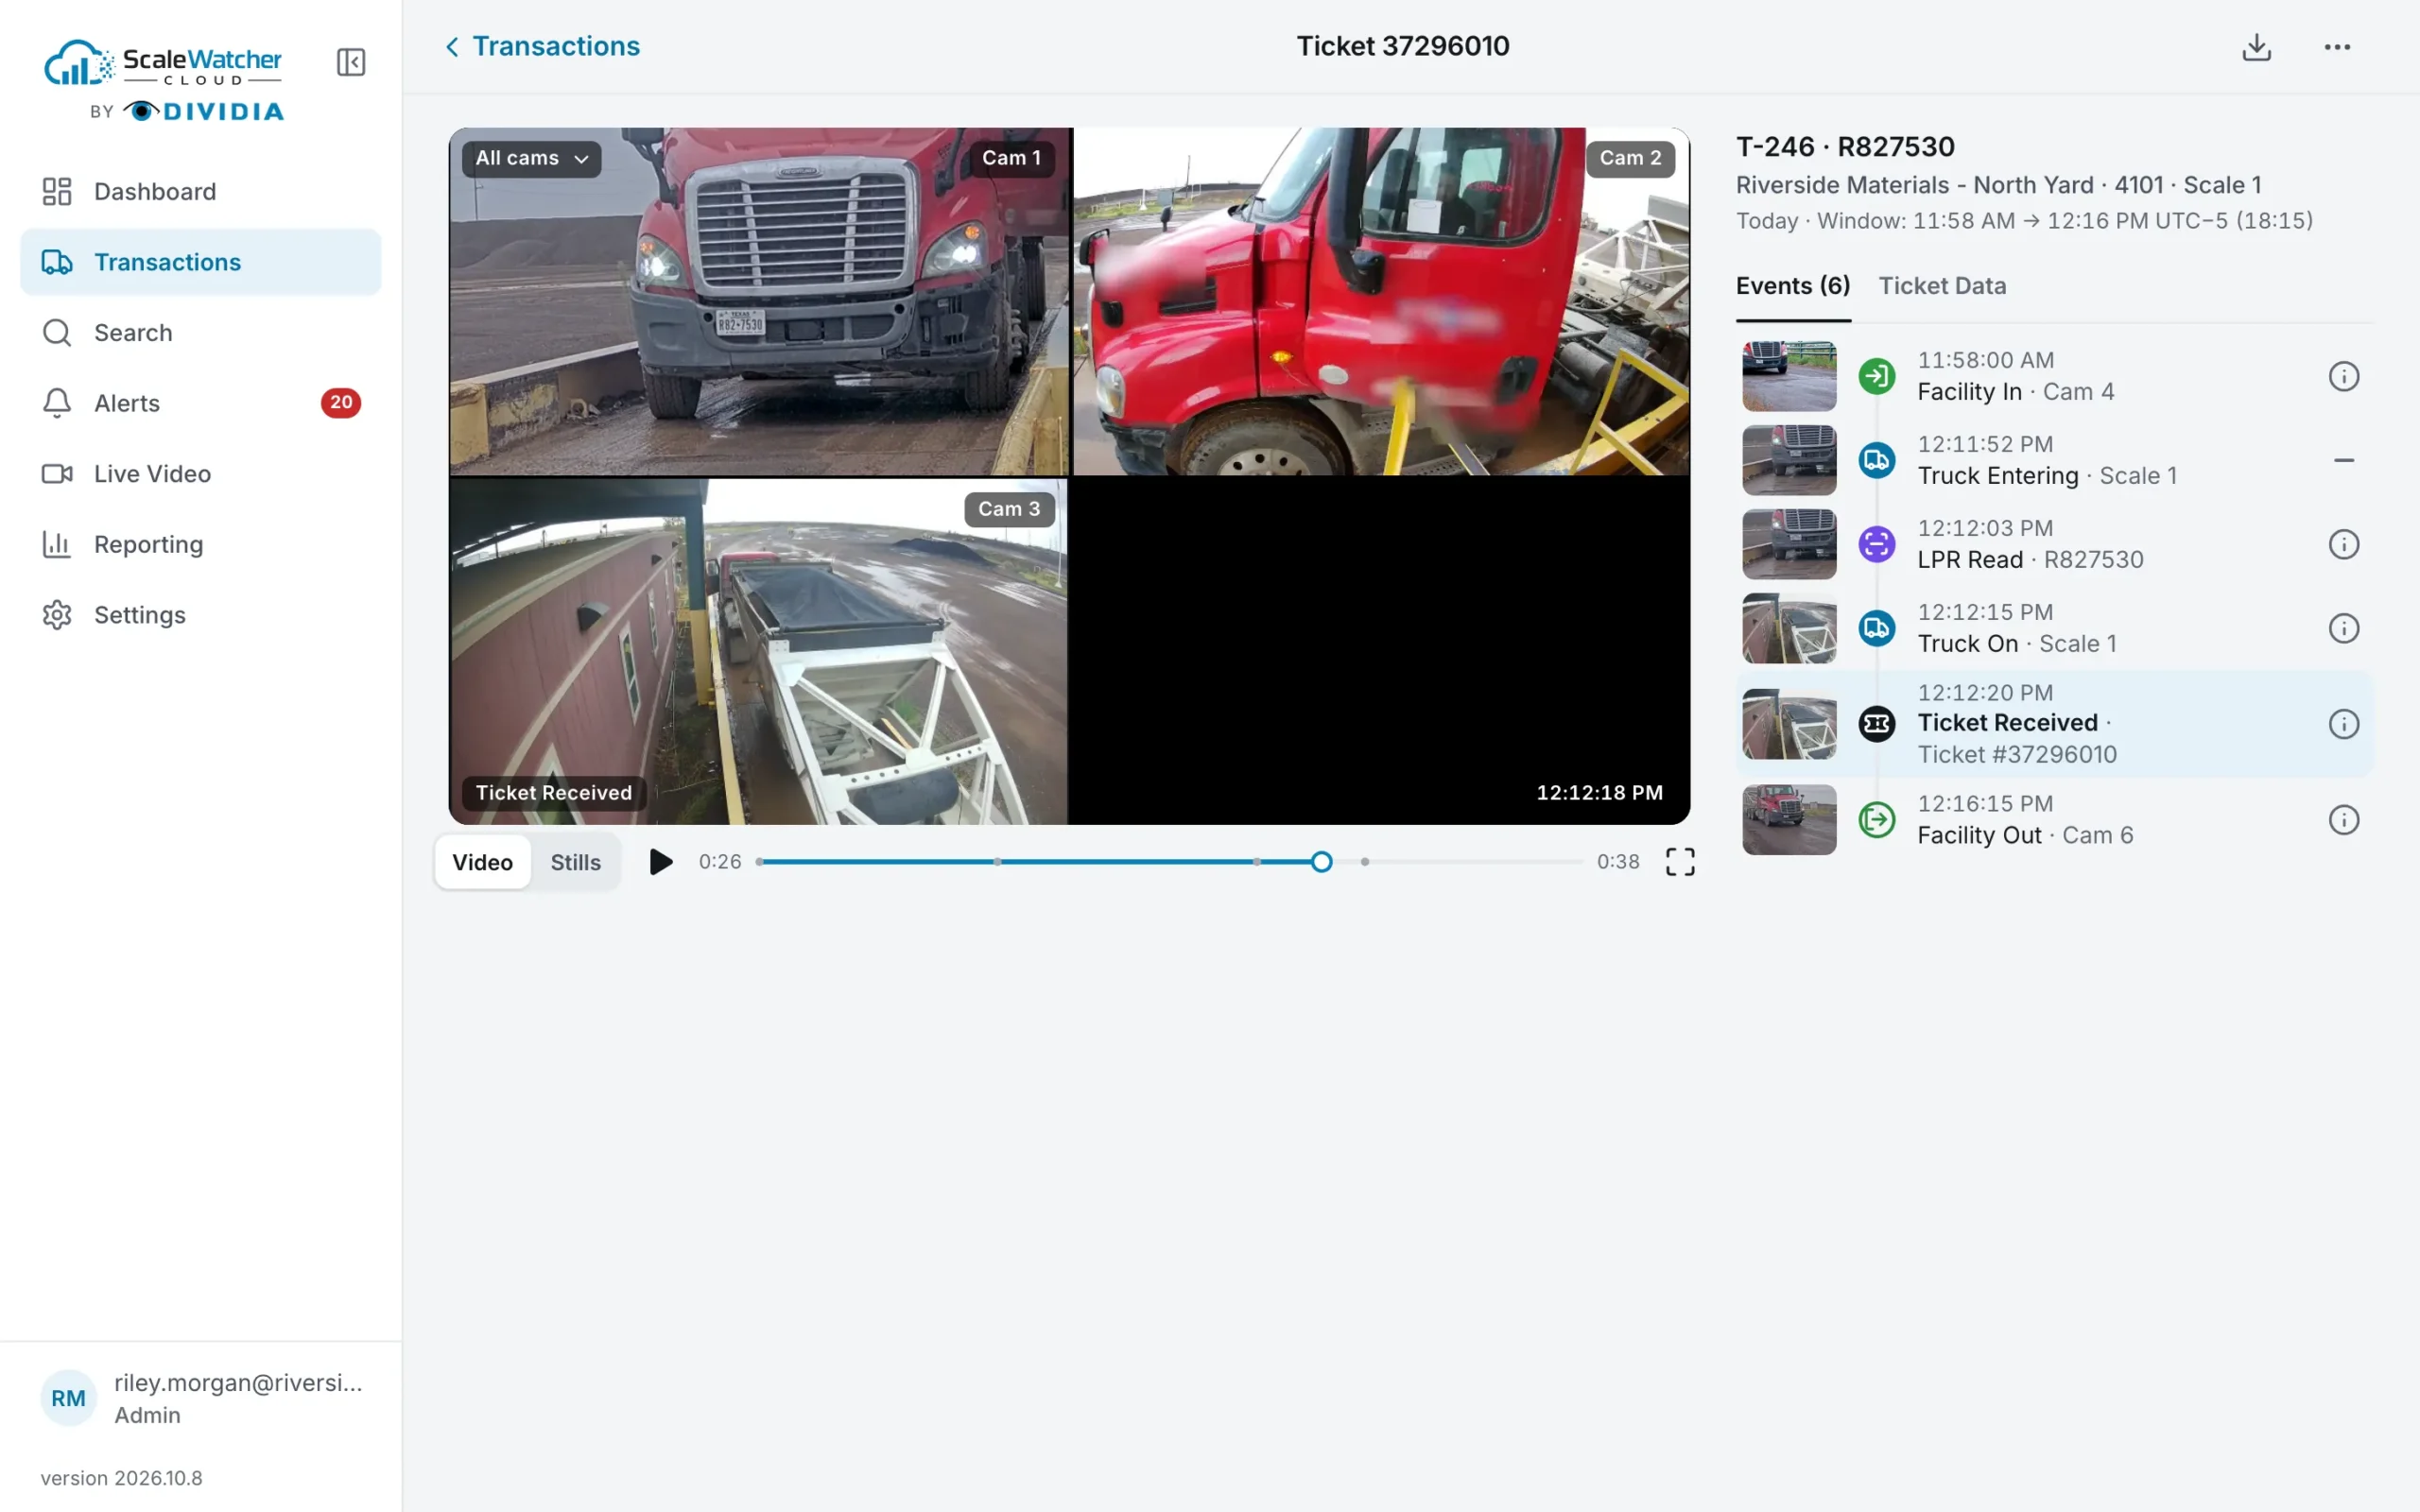
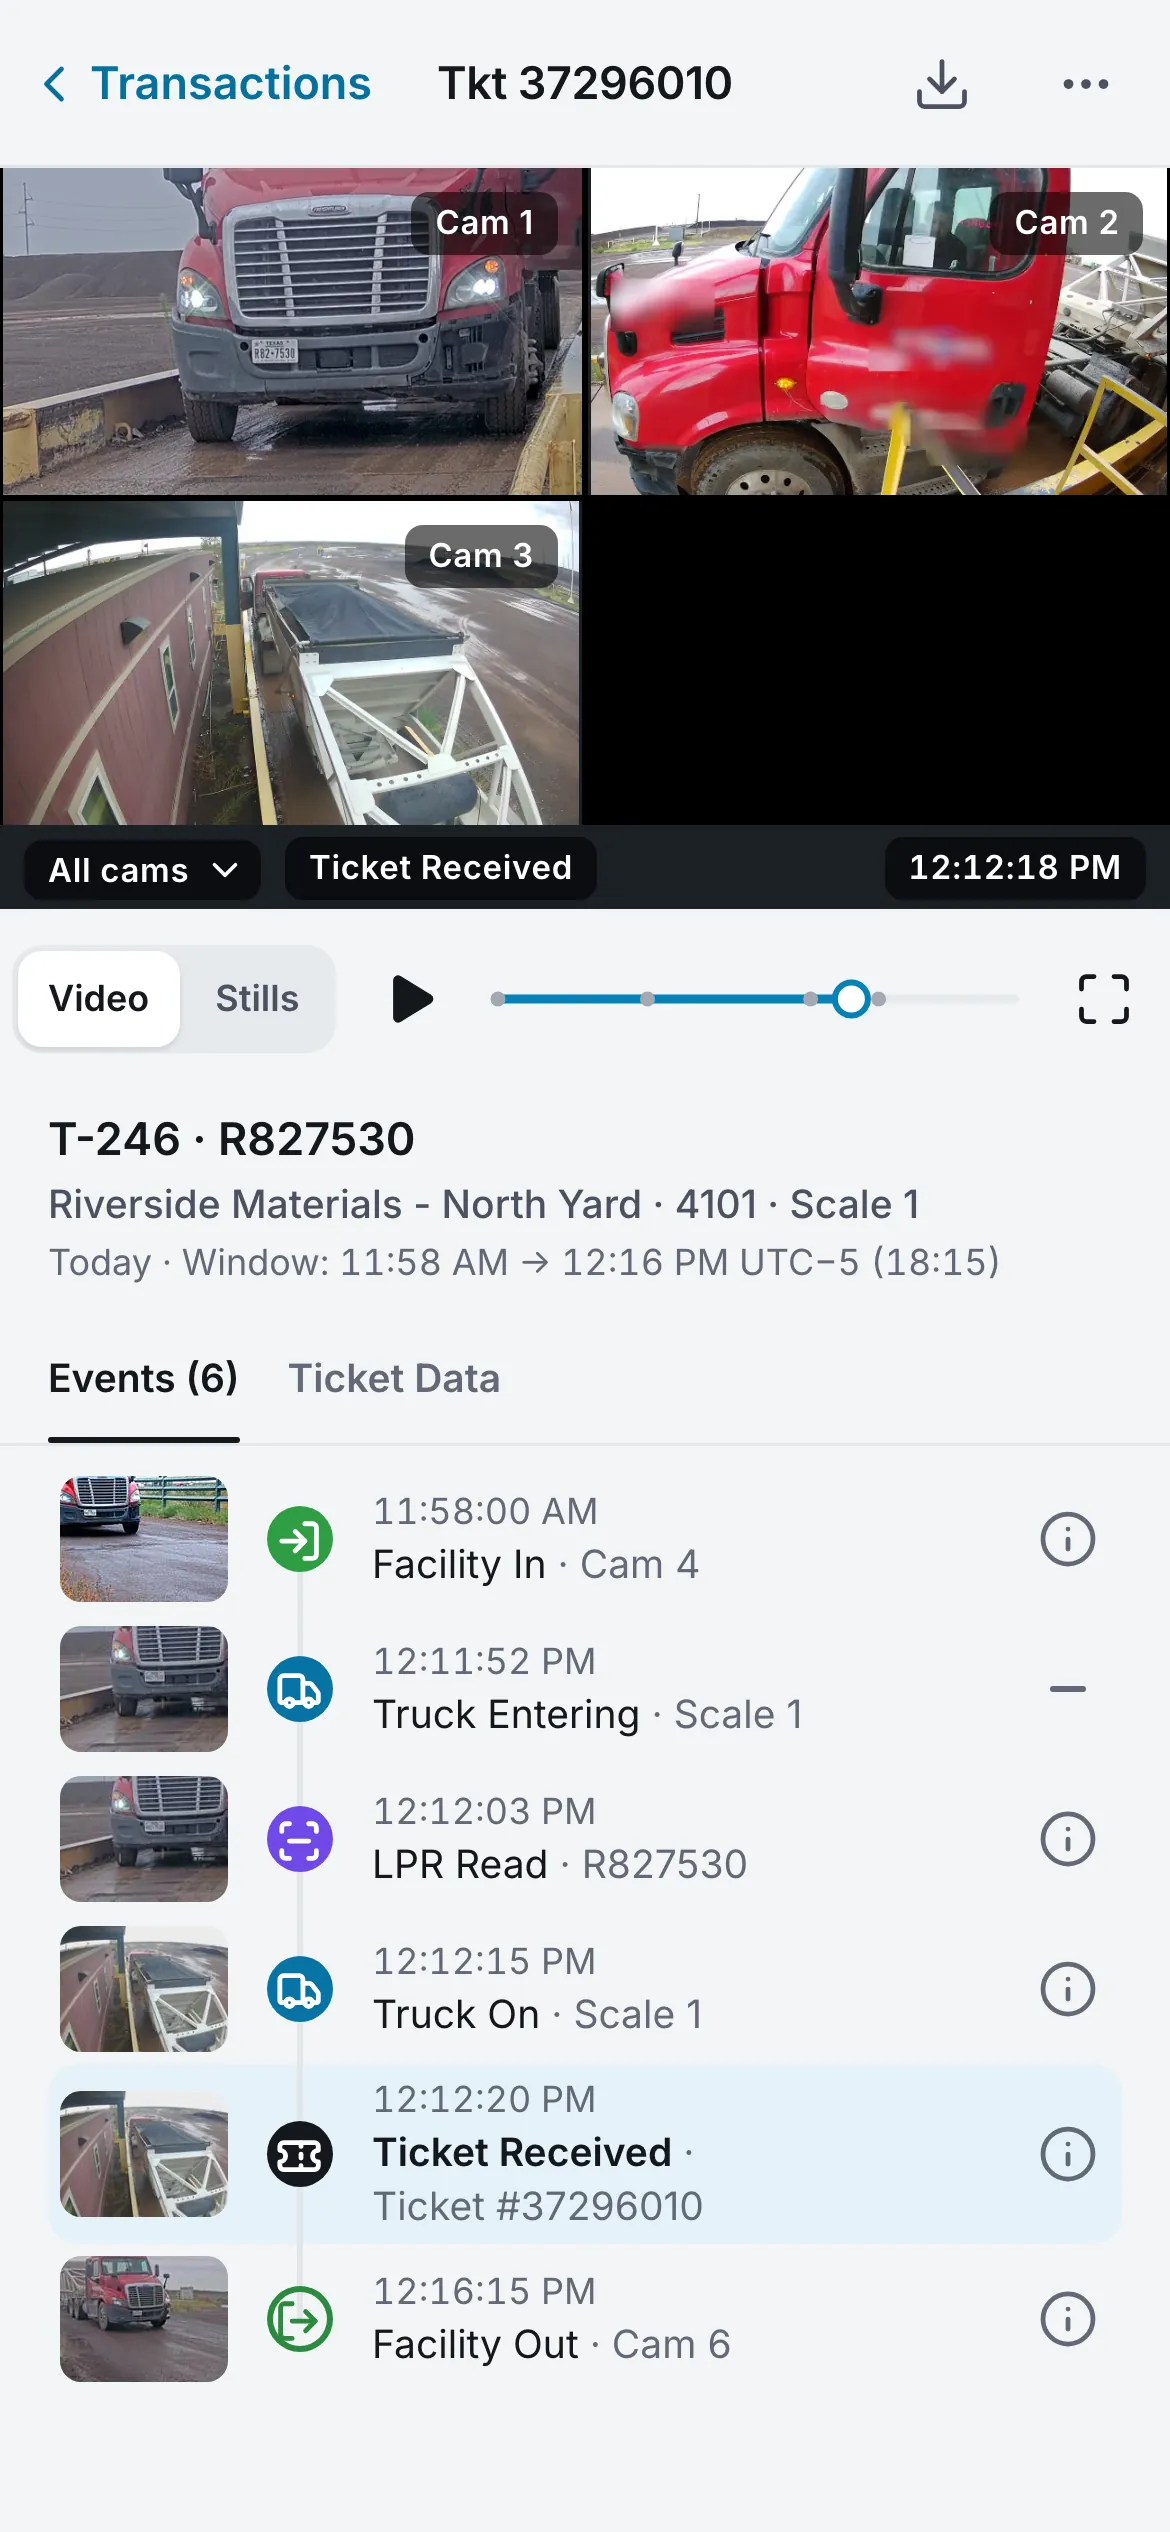
Everything recorded for one transaction: the images, any video, the events and the ticket.
The header gives the truck and LPN, the site and scale, and the window from the first event to the last. The transaction’s alerts are listed under it; tap one to open it.
Images and video
- Where the transaction has a video clip, switch between Video and Stills.
- Pick a camera (Cam 1, Cam 2…) or All cams to see them side by side; double tap a camera to show it alone.
- Tap the video to play or pause; drag Position to move through it; Full screen. Pinch (or scroll, or drag a box) to zoom in; Reset zoom.
- With stills, Previous event and Next event step through the transaction.
Events and Ticket Data
Events lists each event, oldest first, with its time, image and values; tap one to show it. Ticket Data shows the ticket’s fields as your ticketing system sent them.
Download and share
- Download clip: one video file of the transaction (it takes about 20 seconds to prepare).
- Download image, PDF, Share: the still on screen, a Snapshot of the video (desktops), the transaction’s PDF record, or share the link.
7. Search
Find any transaction across your sites.
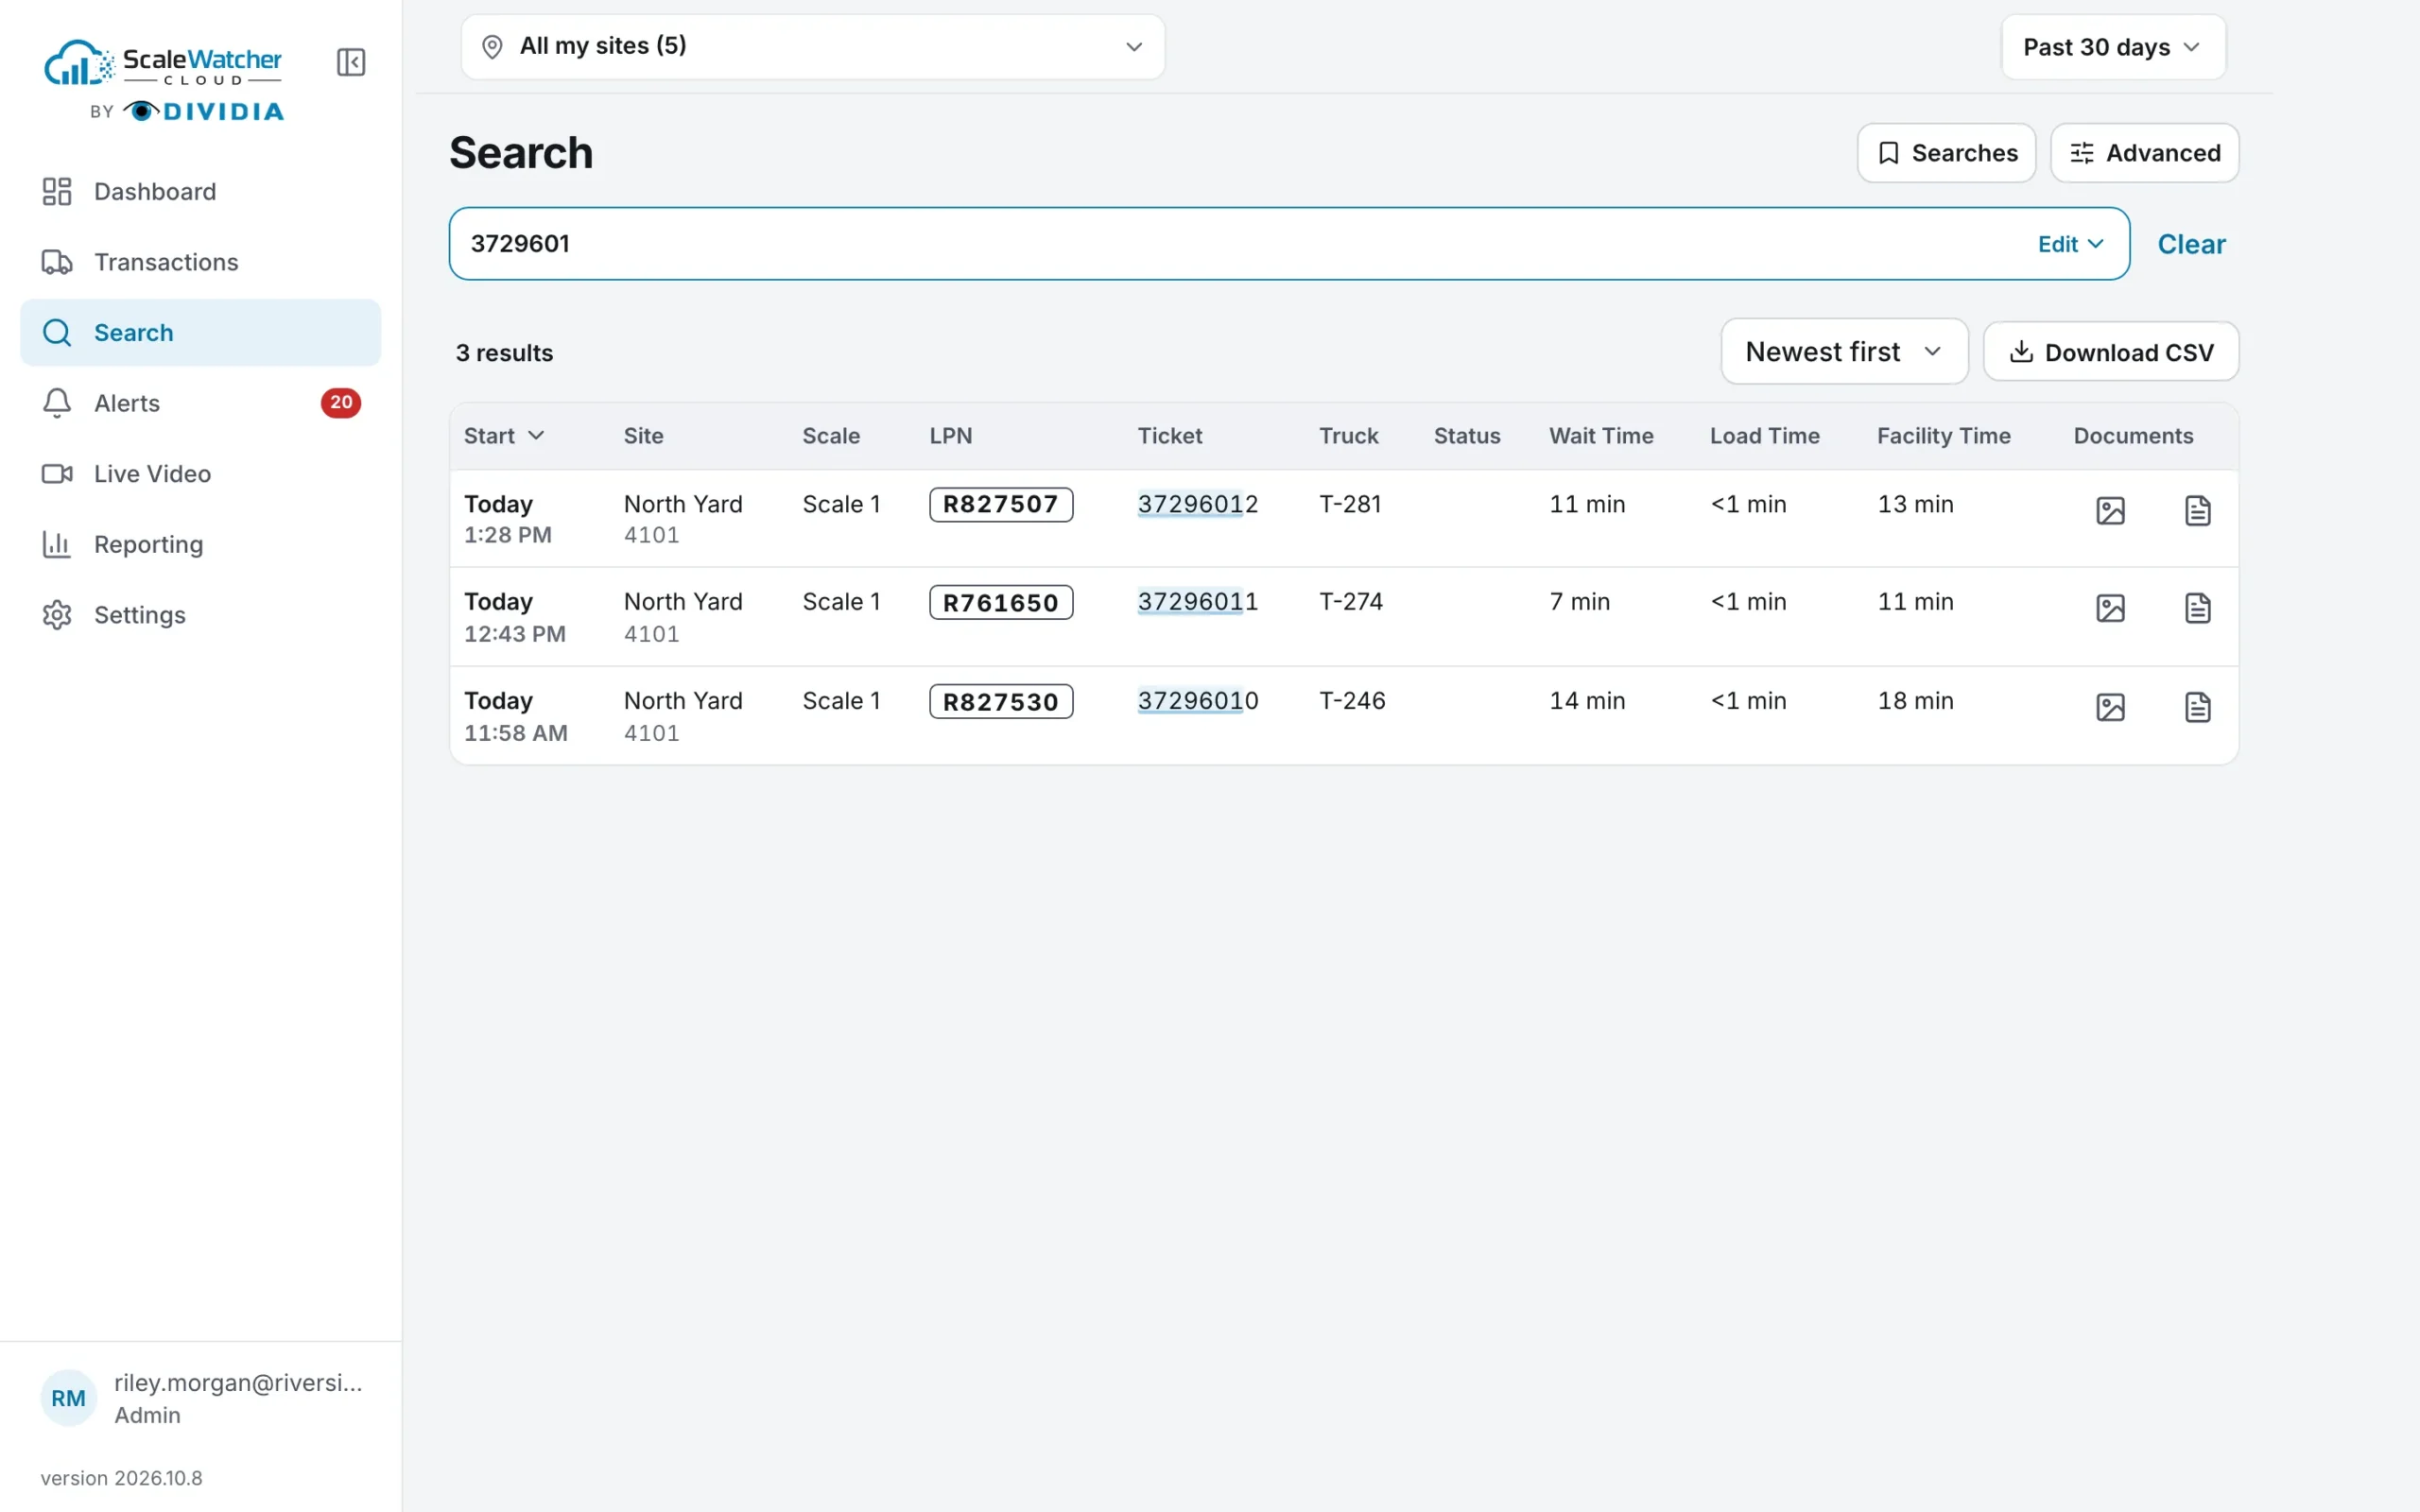
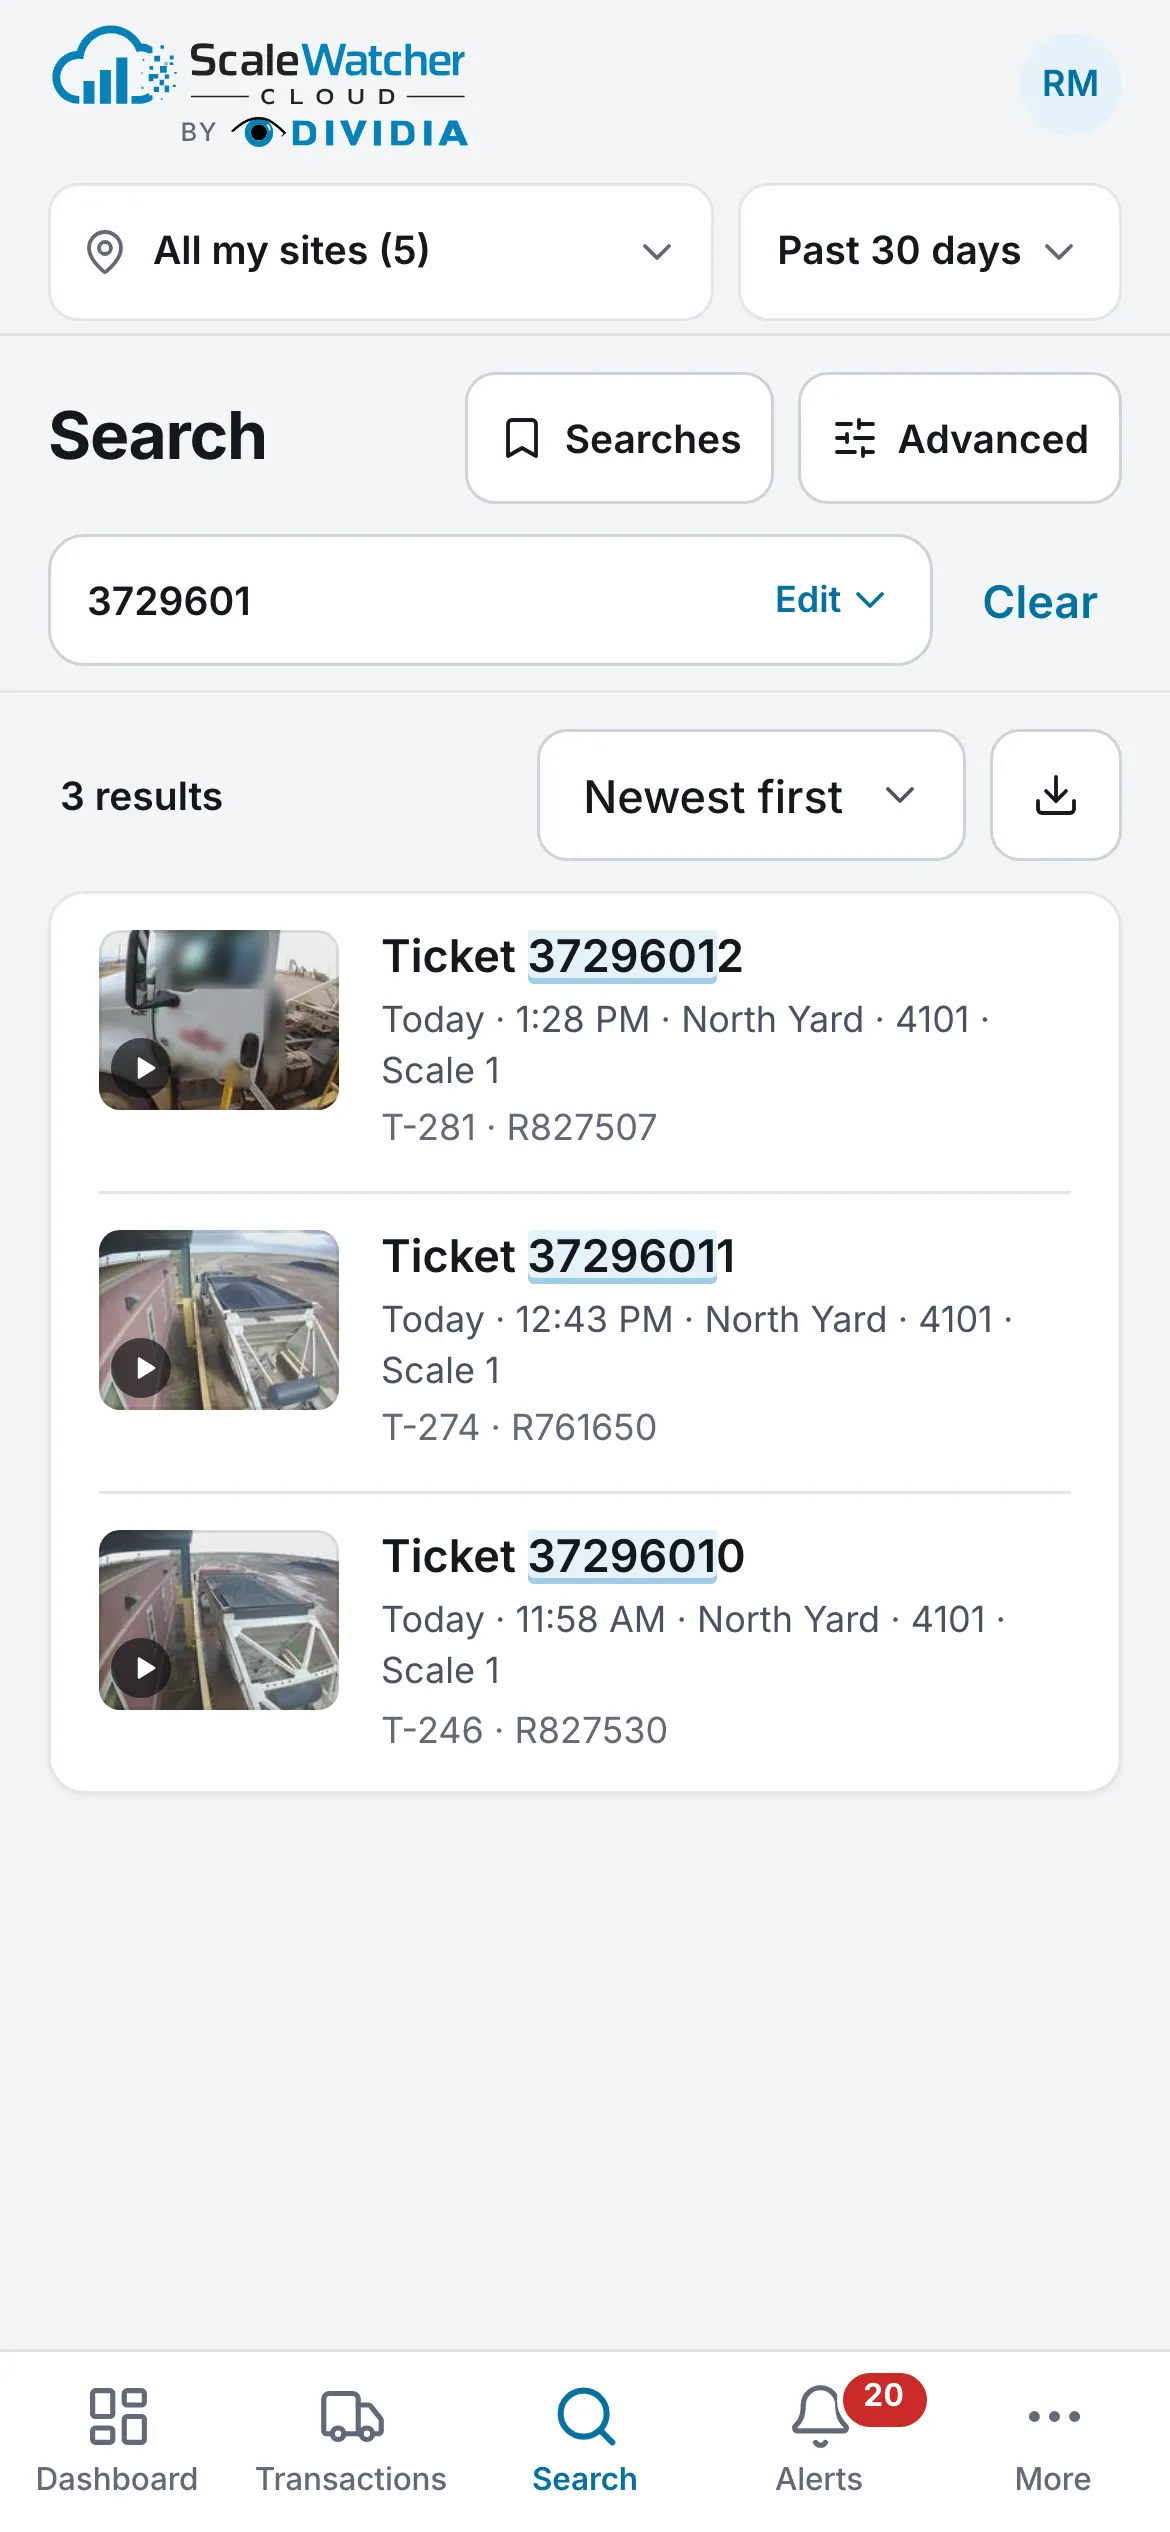
Pick what to search by (All, Ticket, LPN, Truck, Transaction), type at least 3 characters and press Search. The search covers the sites and dates in the bar (by default all your sites, the past 30 days); an exact ticket or transaction number searches all dates. One exact match opens its PDF at once.
Advanced
Advanced adds conditions on transaction and ticket fields: Ticket number, LPN, Truck, Scale Number, Scale Event, Alert Type, Customer, Product, Carrier, Plant, Gross and more. Each condition is a field, a match (is, contains, is greater than…) and a value. A result meets every condition.
Results
- Newest first or Oldest first (the menu above the results); 20, 50 or 100 per page (phones load as you scroll).
- Tap a result for its Transaction Evidence, or Open PDF.
- Download CSV exports the results. Past 10,000 results it asks first: download the first 10,000, or narrow the search.
- Searches lists your recent searches on this device.
8. Alerts
The alerts from your sites, in queues, and the work on each one.
Queues
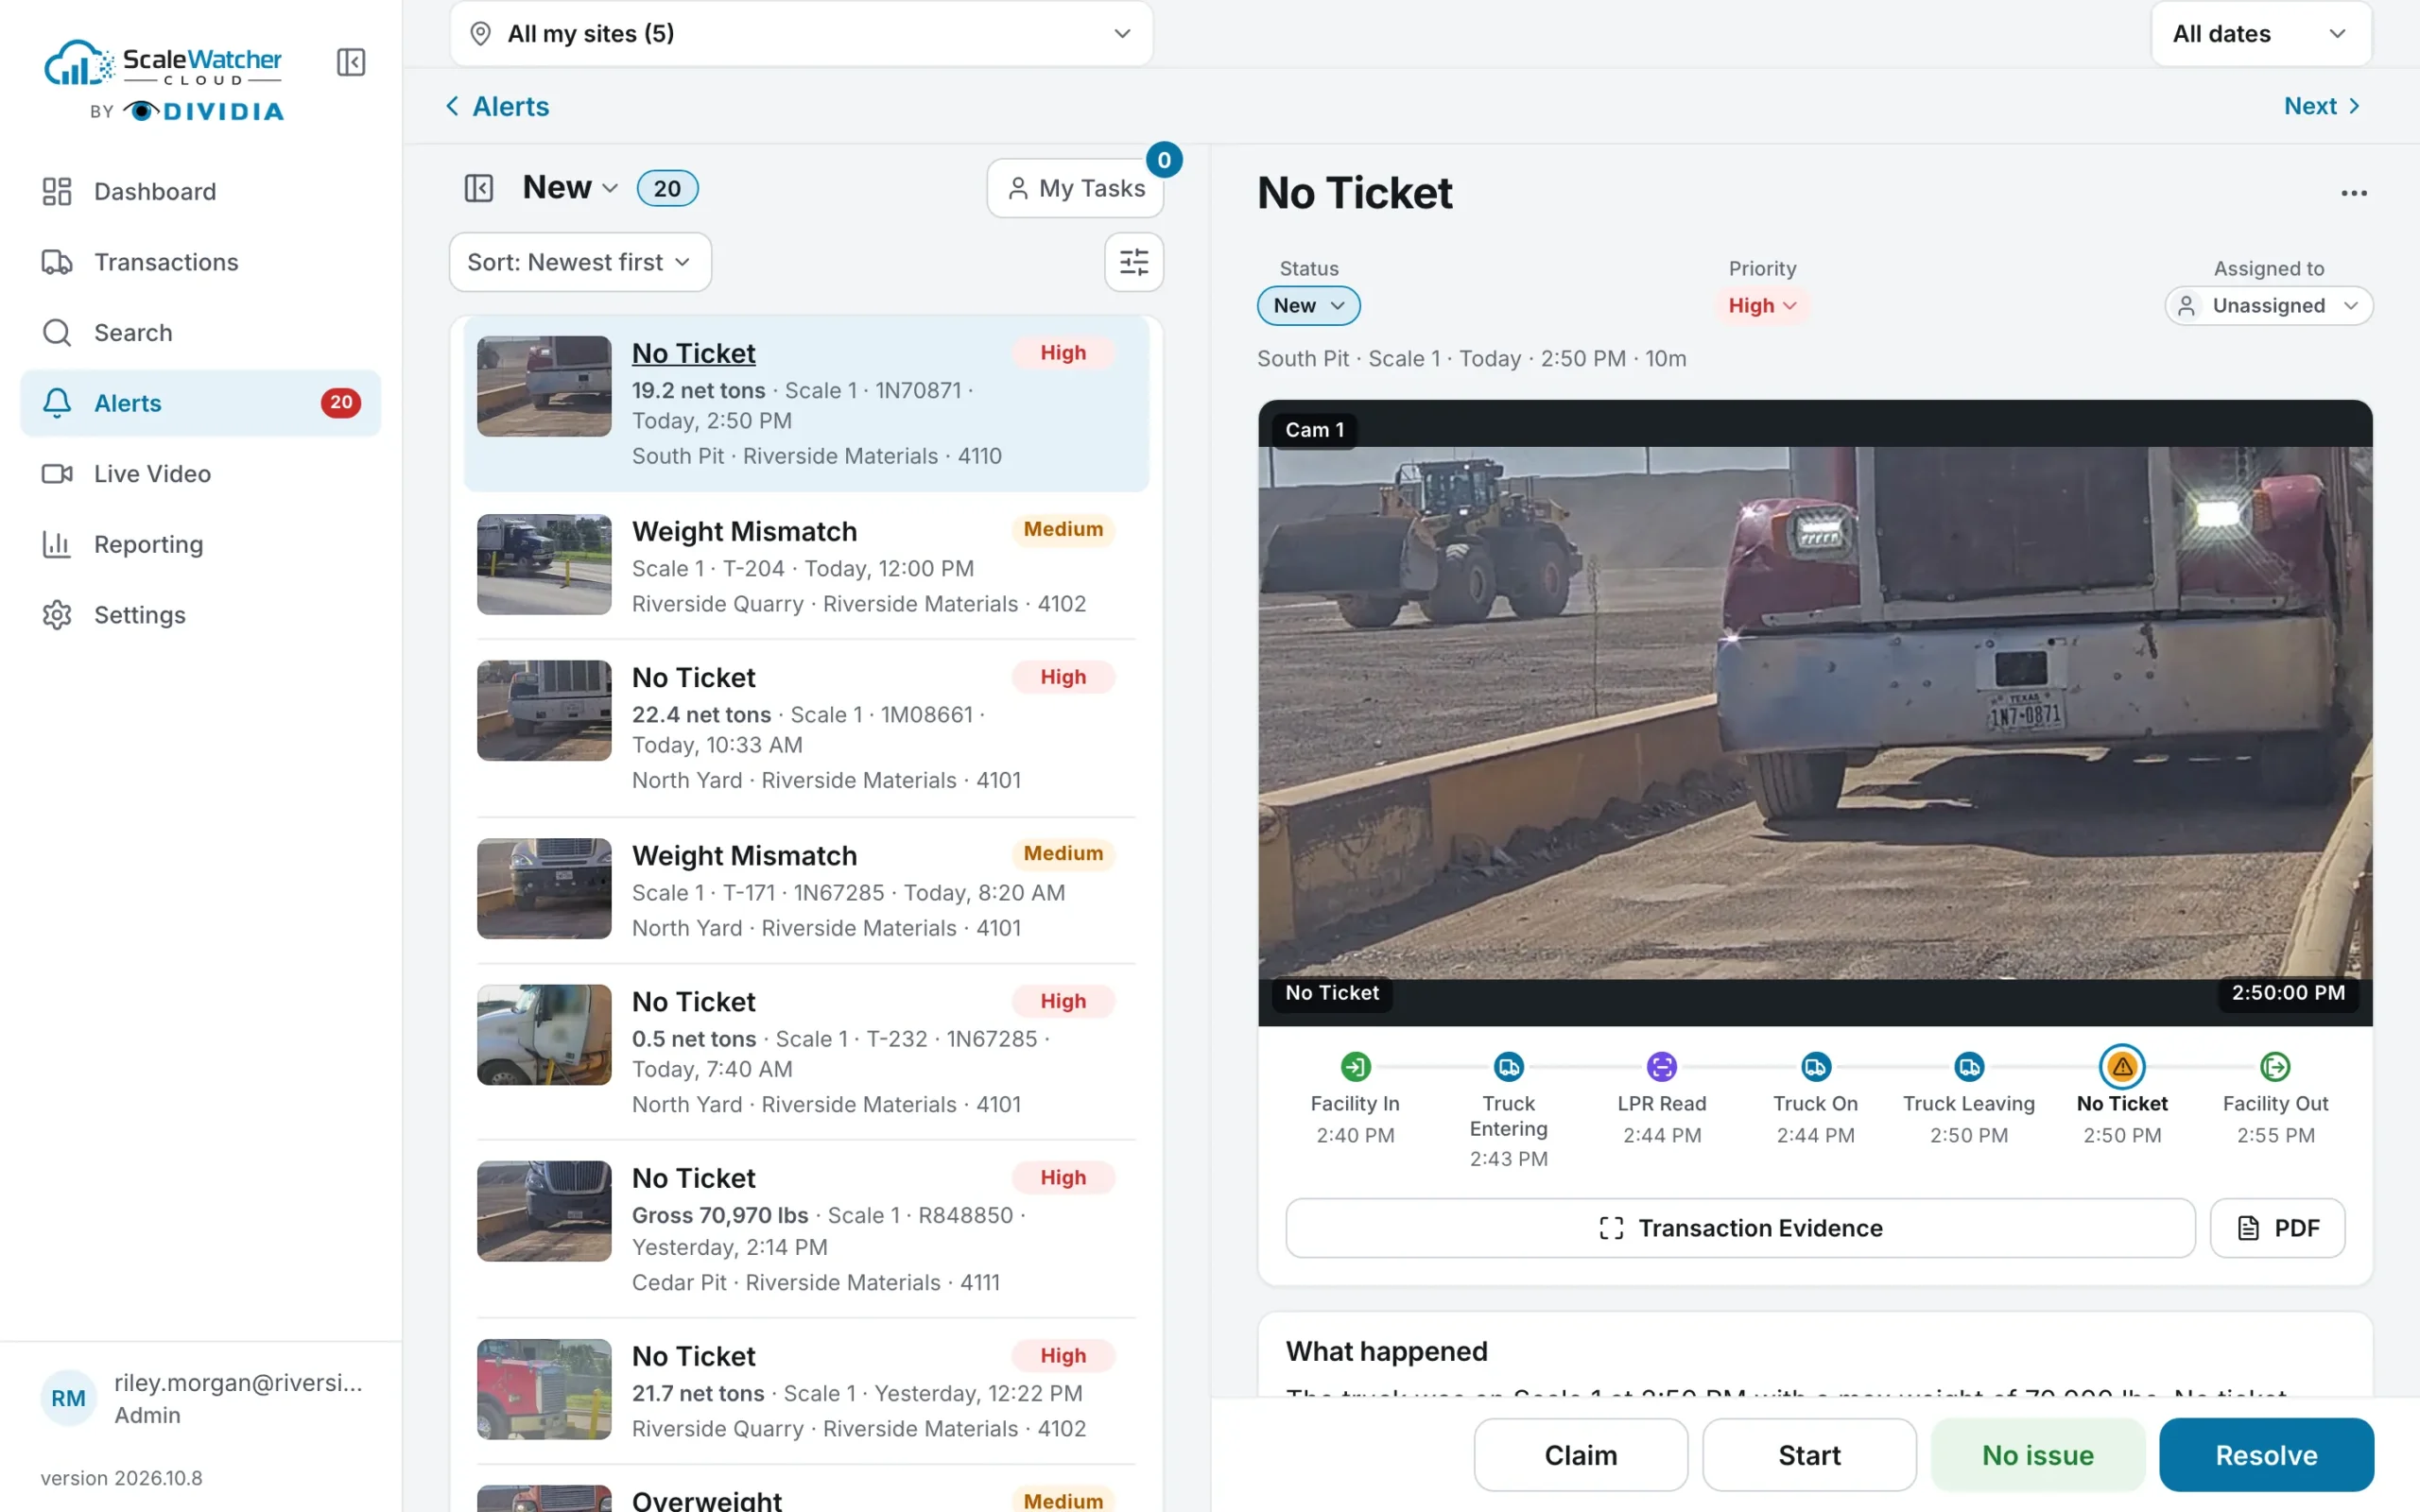
New, My Tasks, Assigned, In Progress, Past Due, Possible Theft, Confirmed Theft and Resolved. Tap the heading to change queue. The Alerts badge in the navigation opens New. Sort by date, priority or last update; Filter alerts by type, priority, scale, person or comment. On tablets and desktops the list sits beside the open alert.
Working an alert
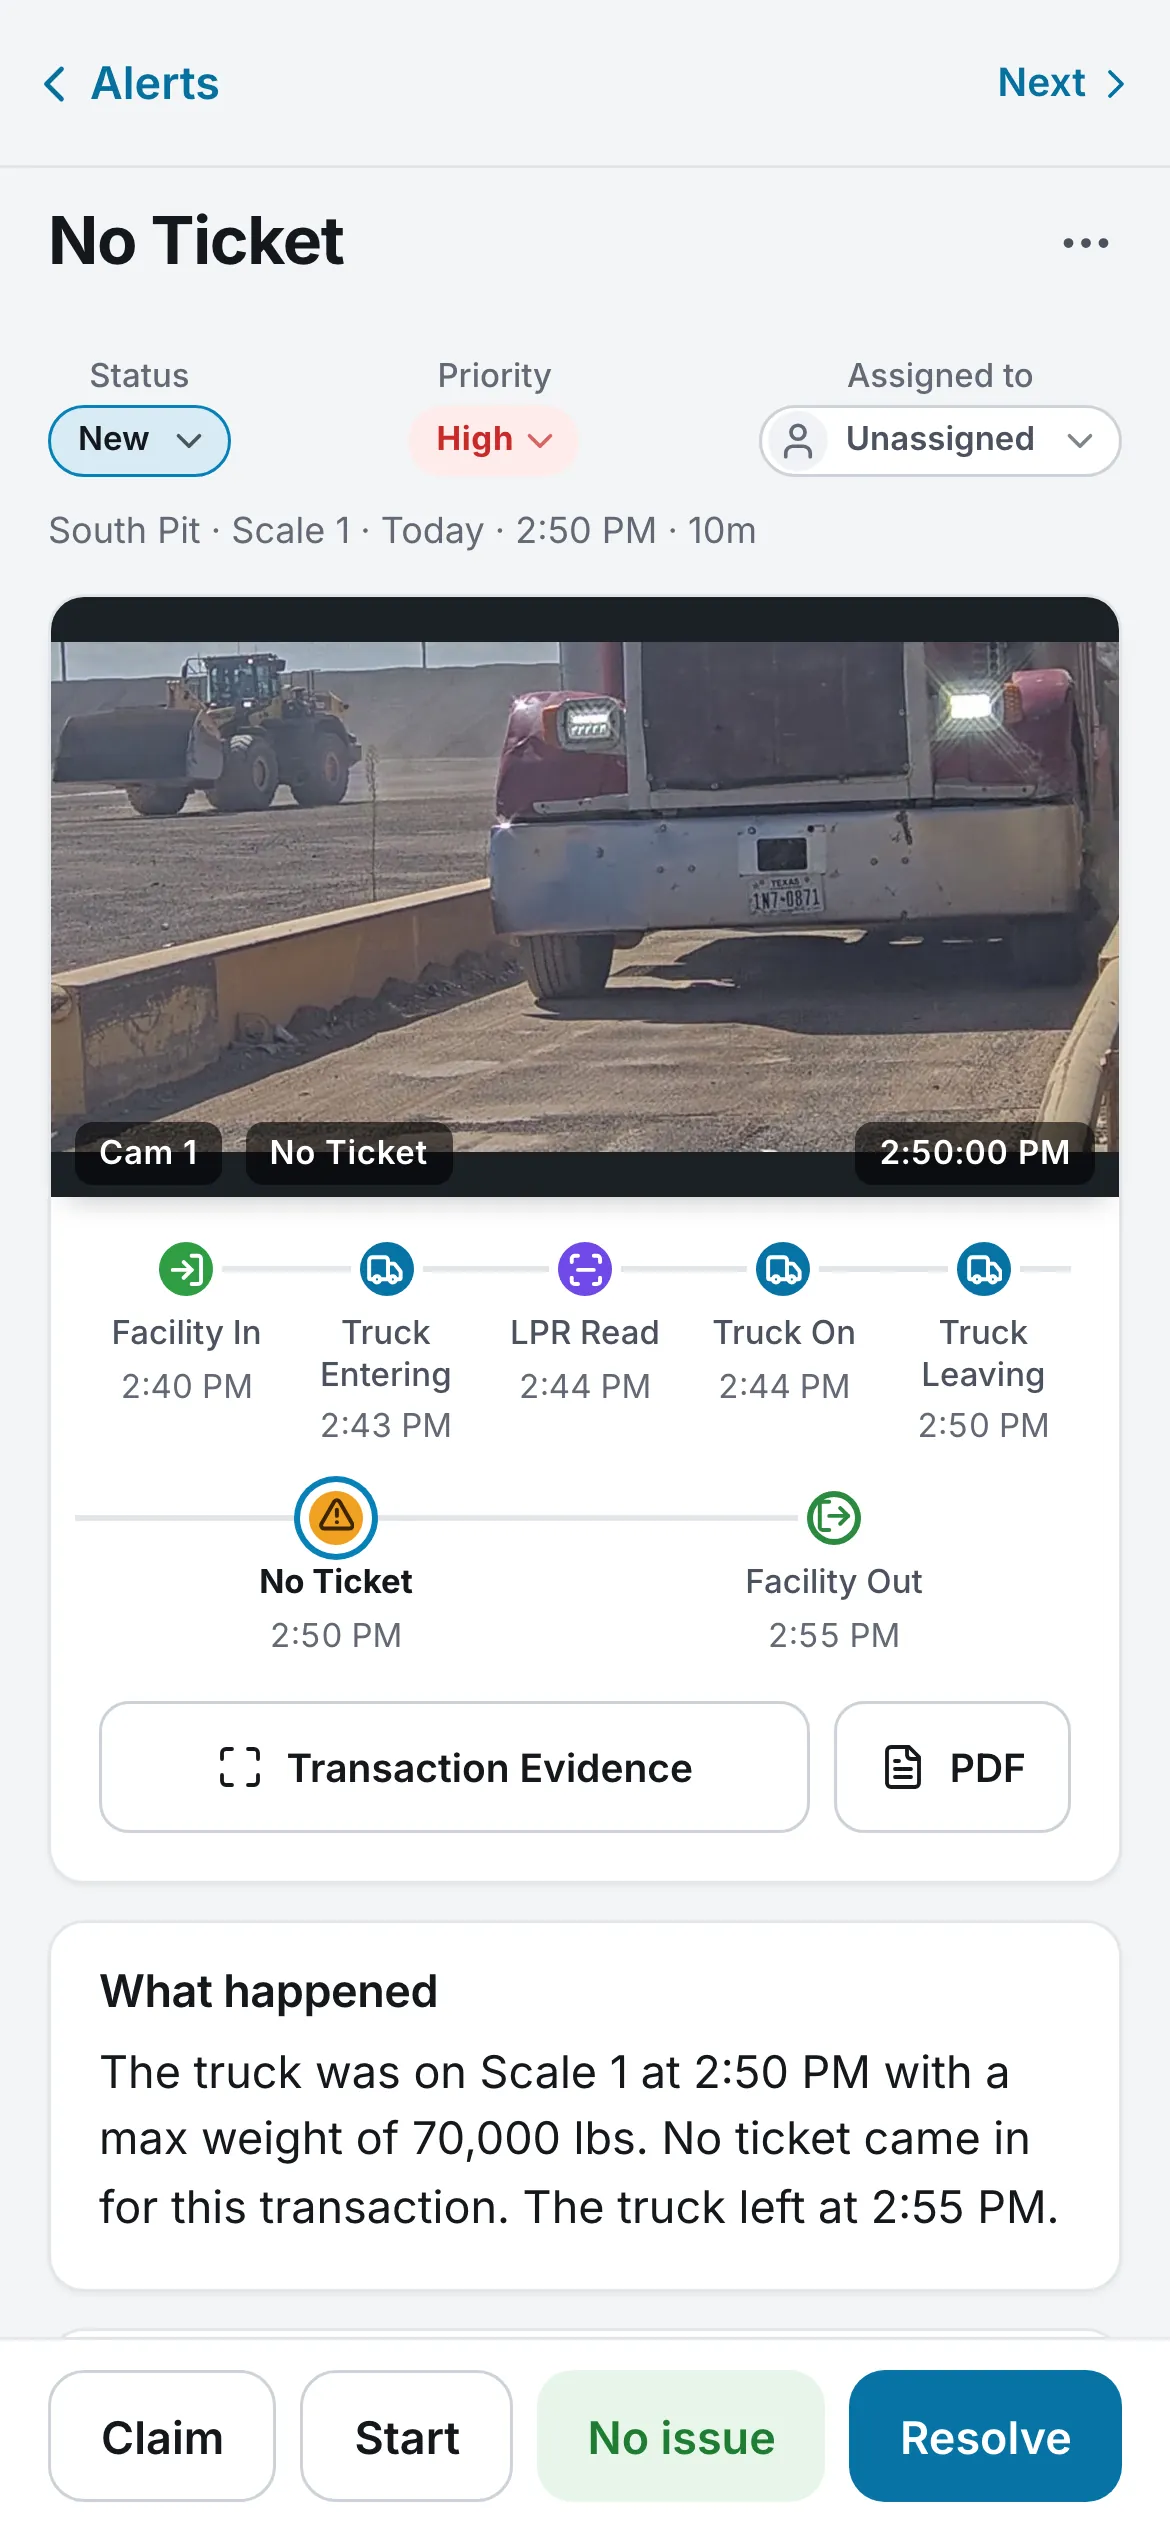
- Open it: the truck’s images (and its video clip, if it has one), What happened, and the facts (truck, LPN, weights, ticket, scale).
- Claim it to make it yours, or Start to claim it and set it In Progress.
- Add comments as you look into it; the History keeps every change and who made it.
- Resolve: pick the outcome, No issue or Issue found, and add a comment (some sites require one). No issue on the action bar resolves it at once.
Mark an alert Possible Theft while it is checked; only Admins set Confirmed Theft. Next opens the next alert in the queue.
Who does what
- Everyone except View only accounts can claim an alert and comment.
- The owner or an Admin can release it.
- Admins assign alerts, set priority, add or remove the Past Due tag, and reopen resolved alerts.
- Select works many alerts at once (up to 100).
9. Live Video
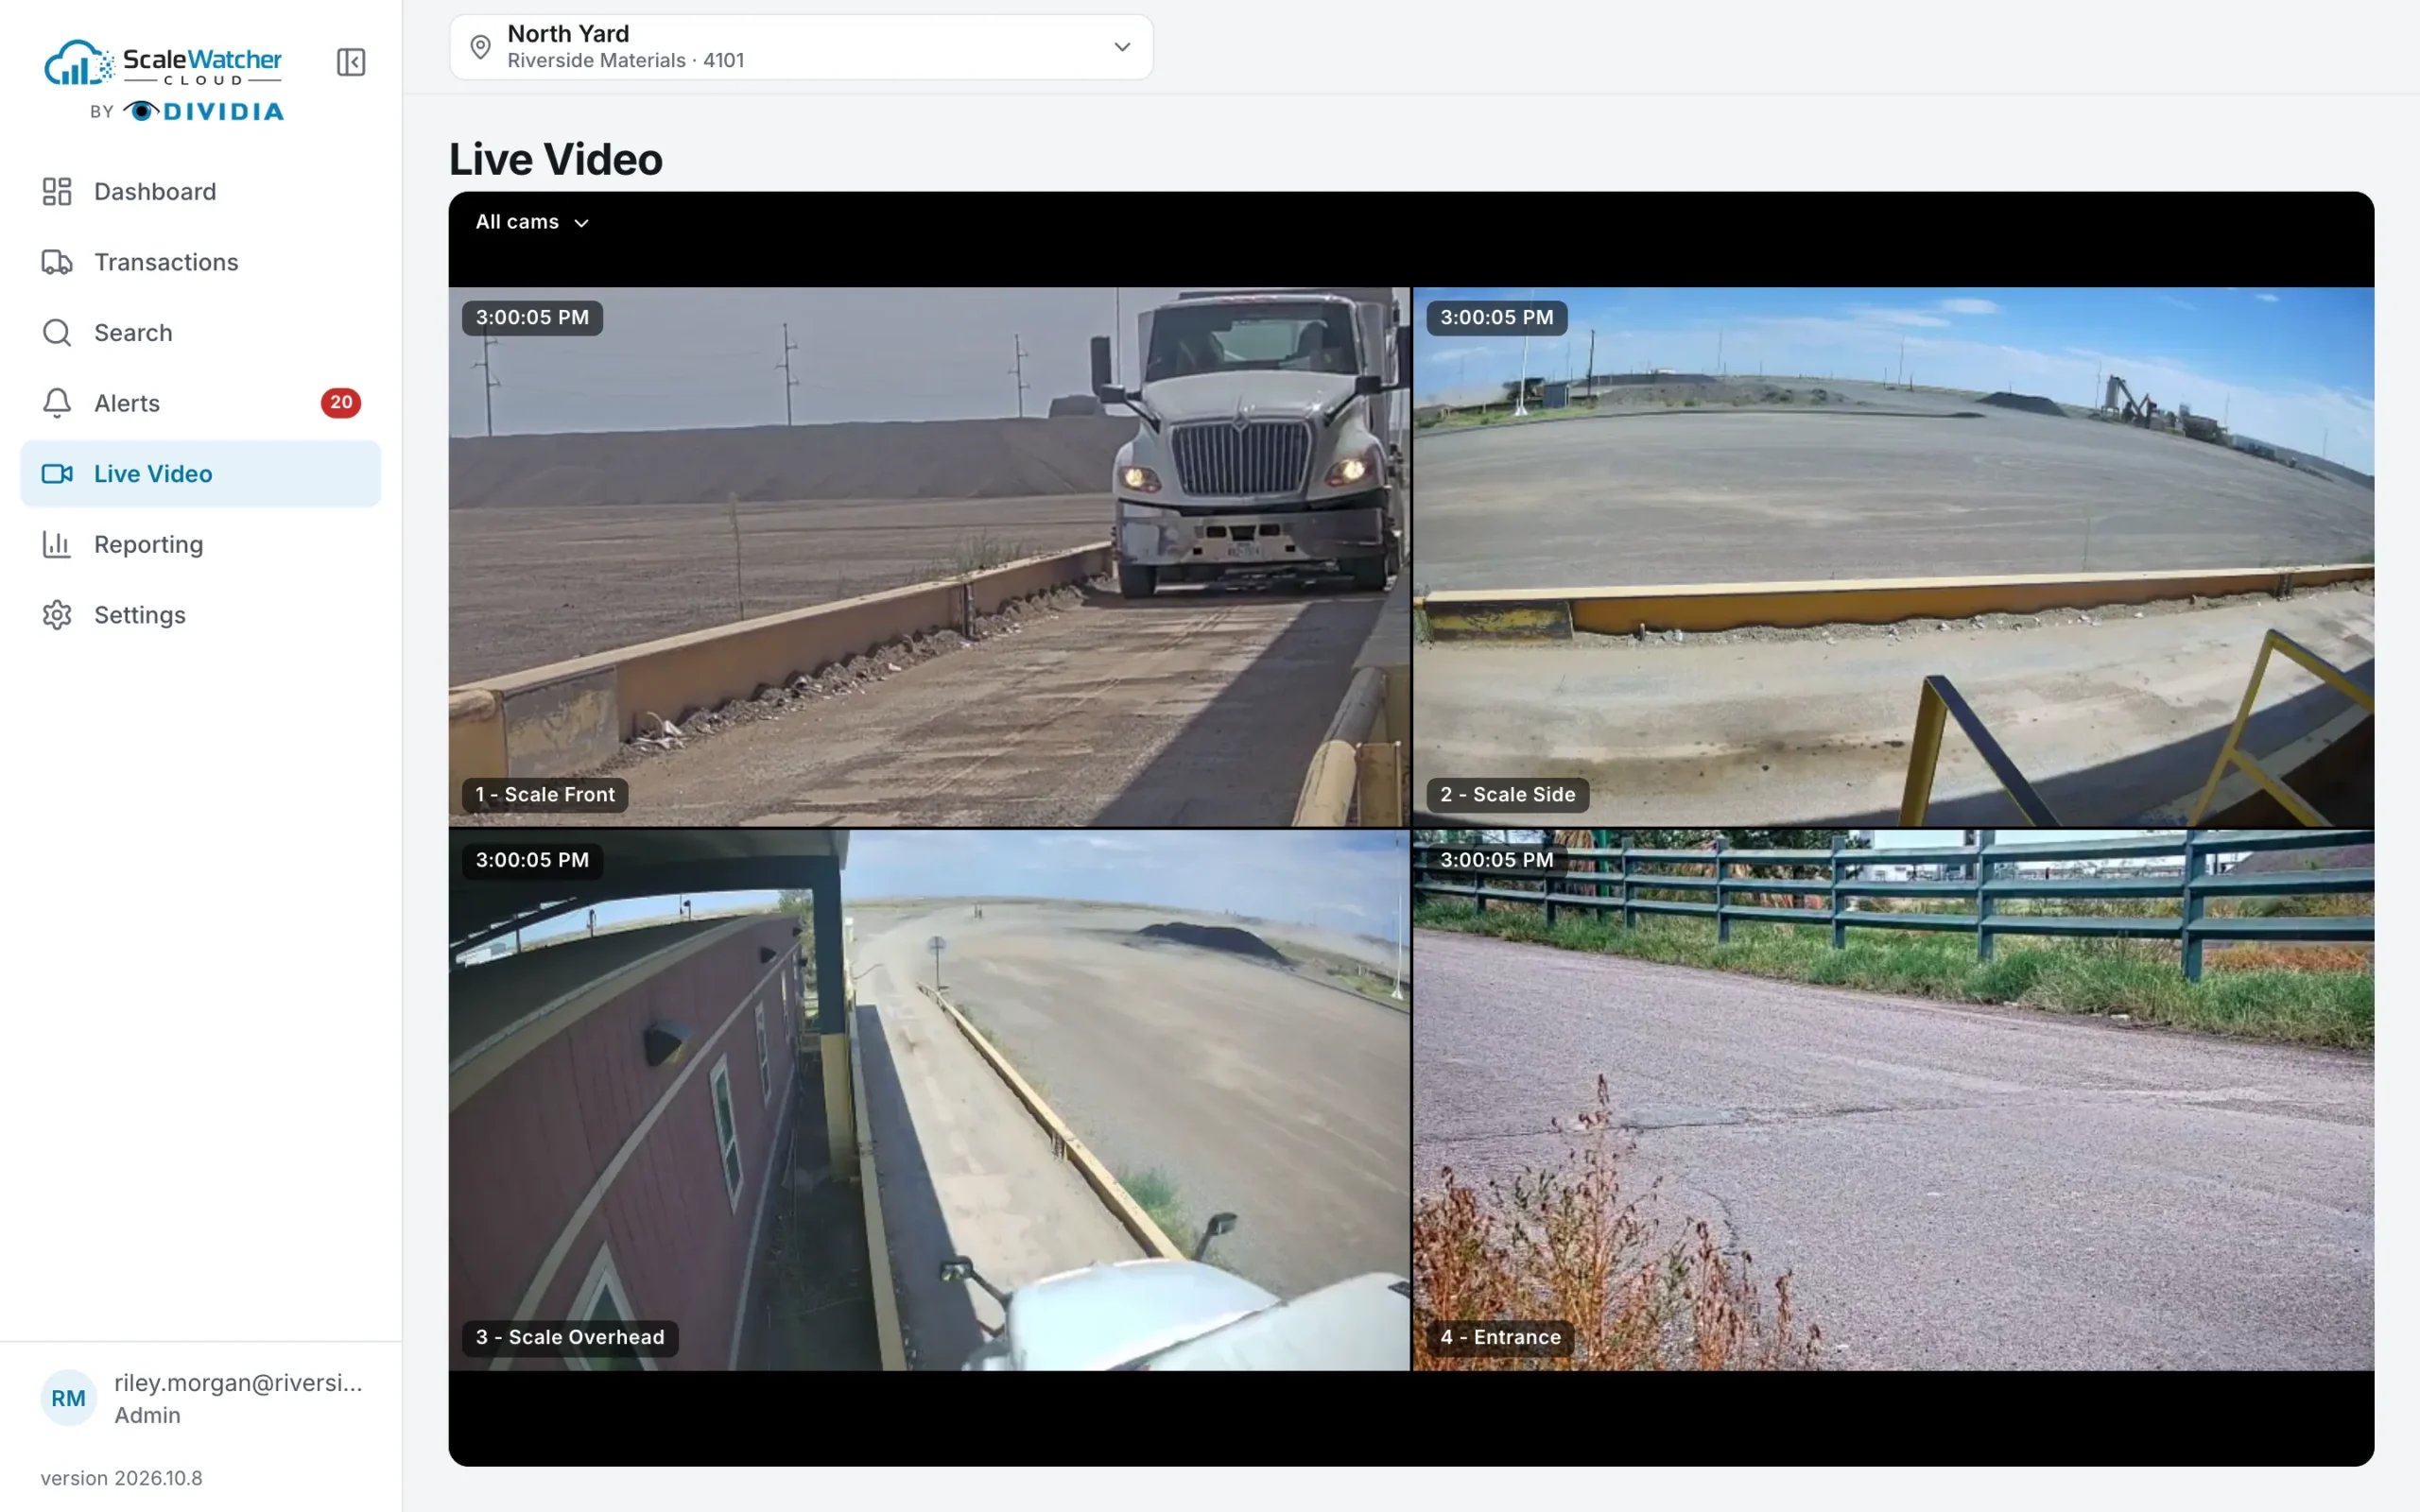
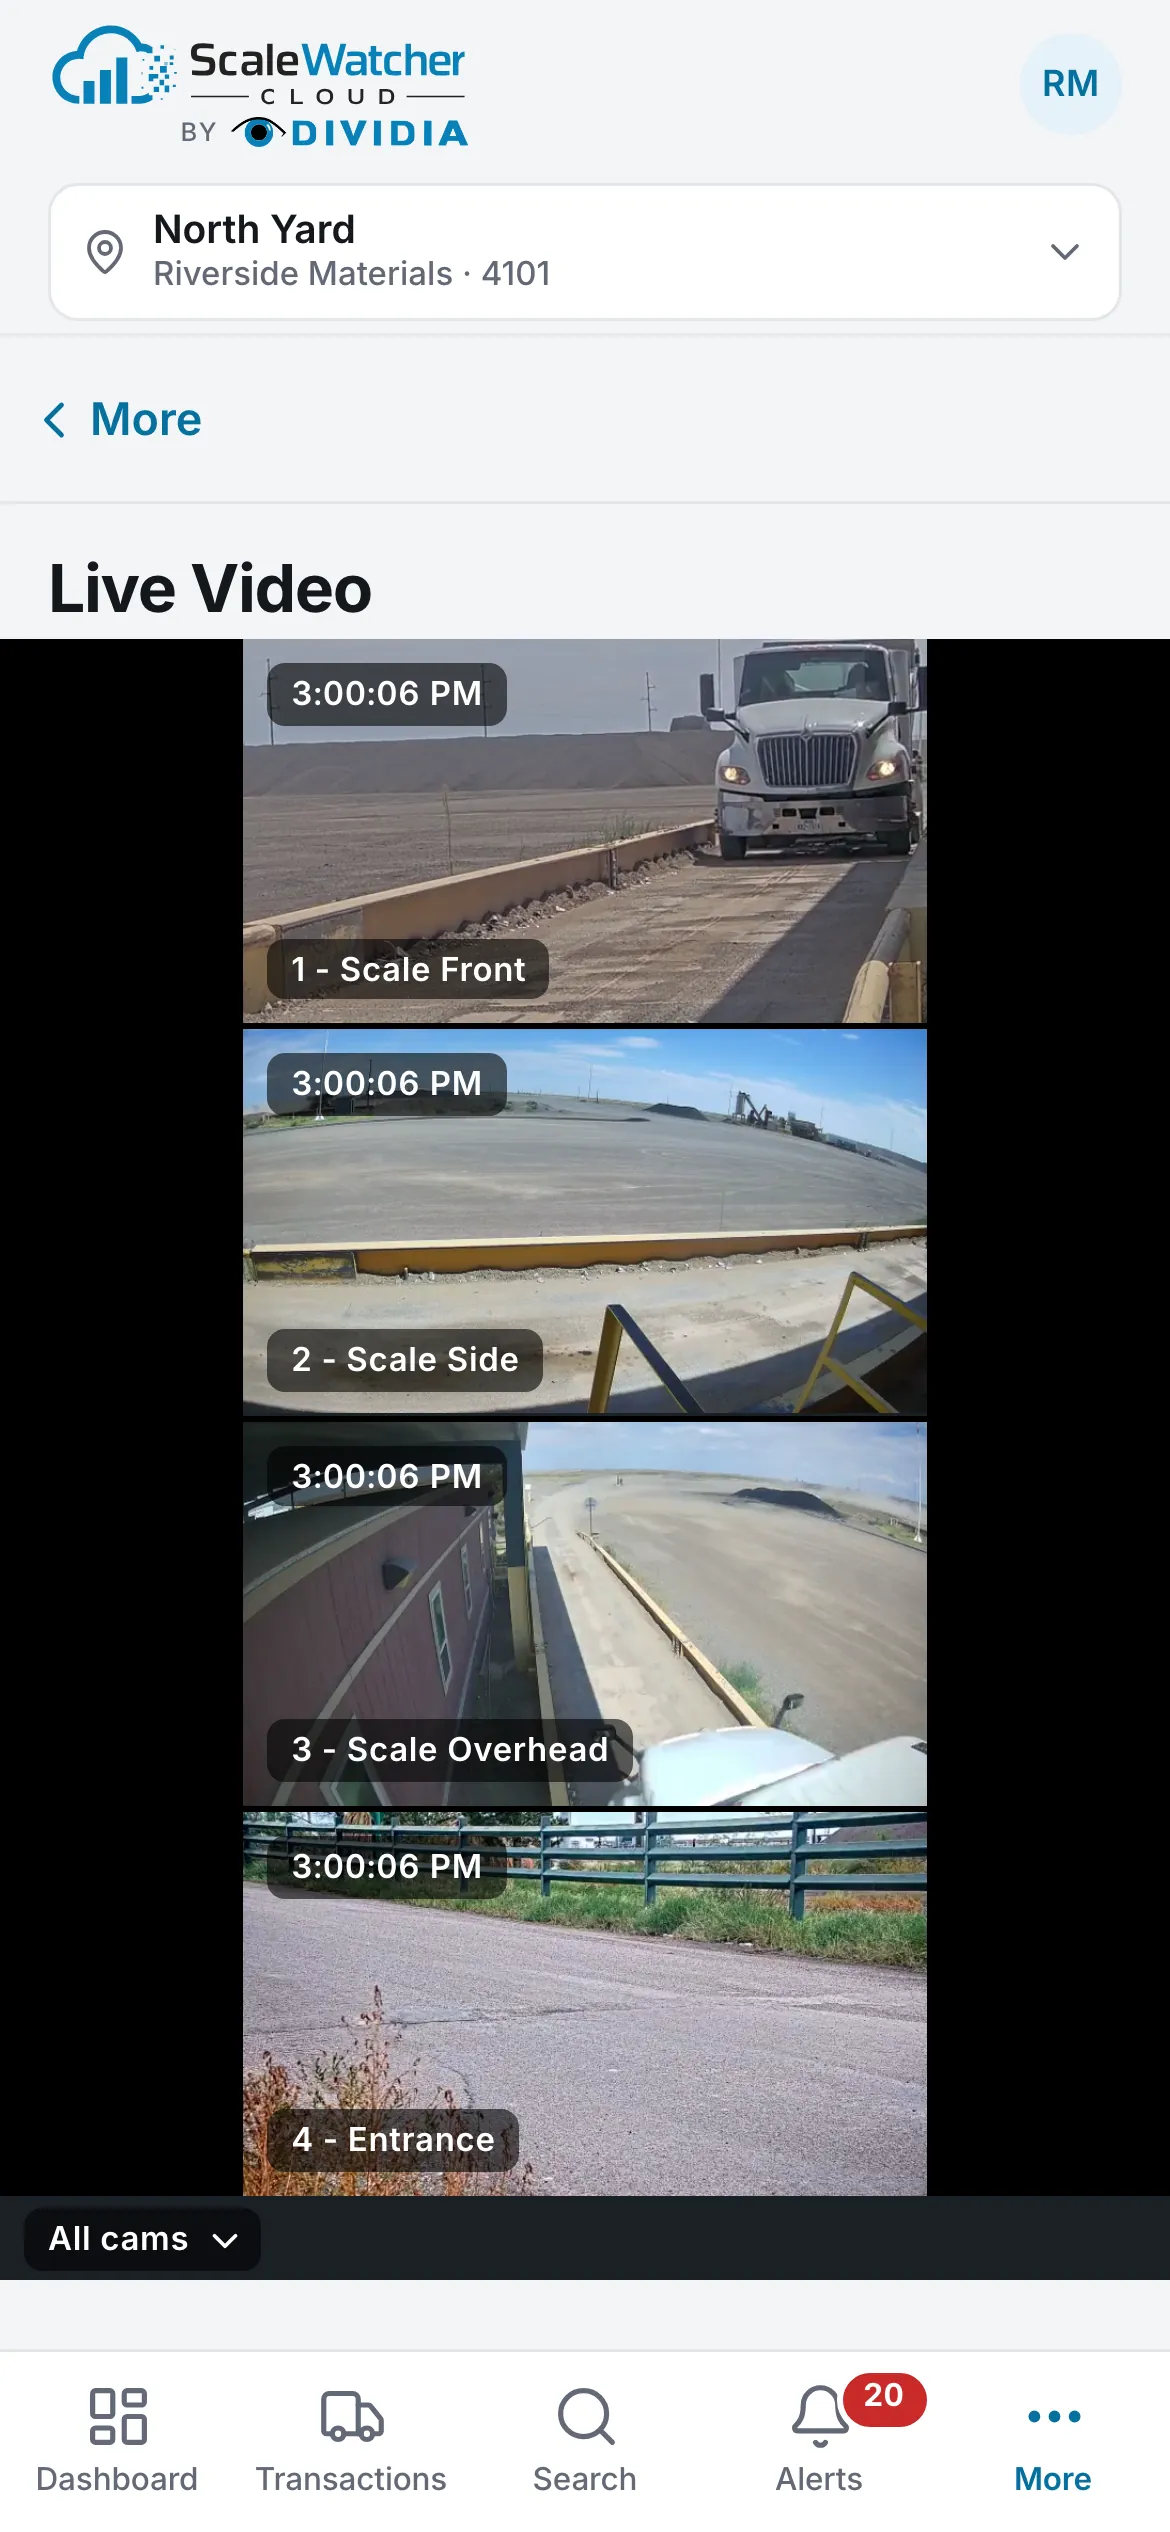
The site’s cameras, live. For people with the Live Video right.
Live Video follows the site picked in the bar. Depending on the site’s NVR, the cameras play in the app, or Open Live Video opens the NVR’s own viewer in a new tab, which asks for its own login. With All my sites, each site has its own row.
The Dashboard’s Site operations view also has a Live Video card at sites whose NVR supports it.
10. Reporting
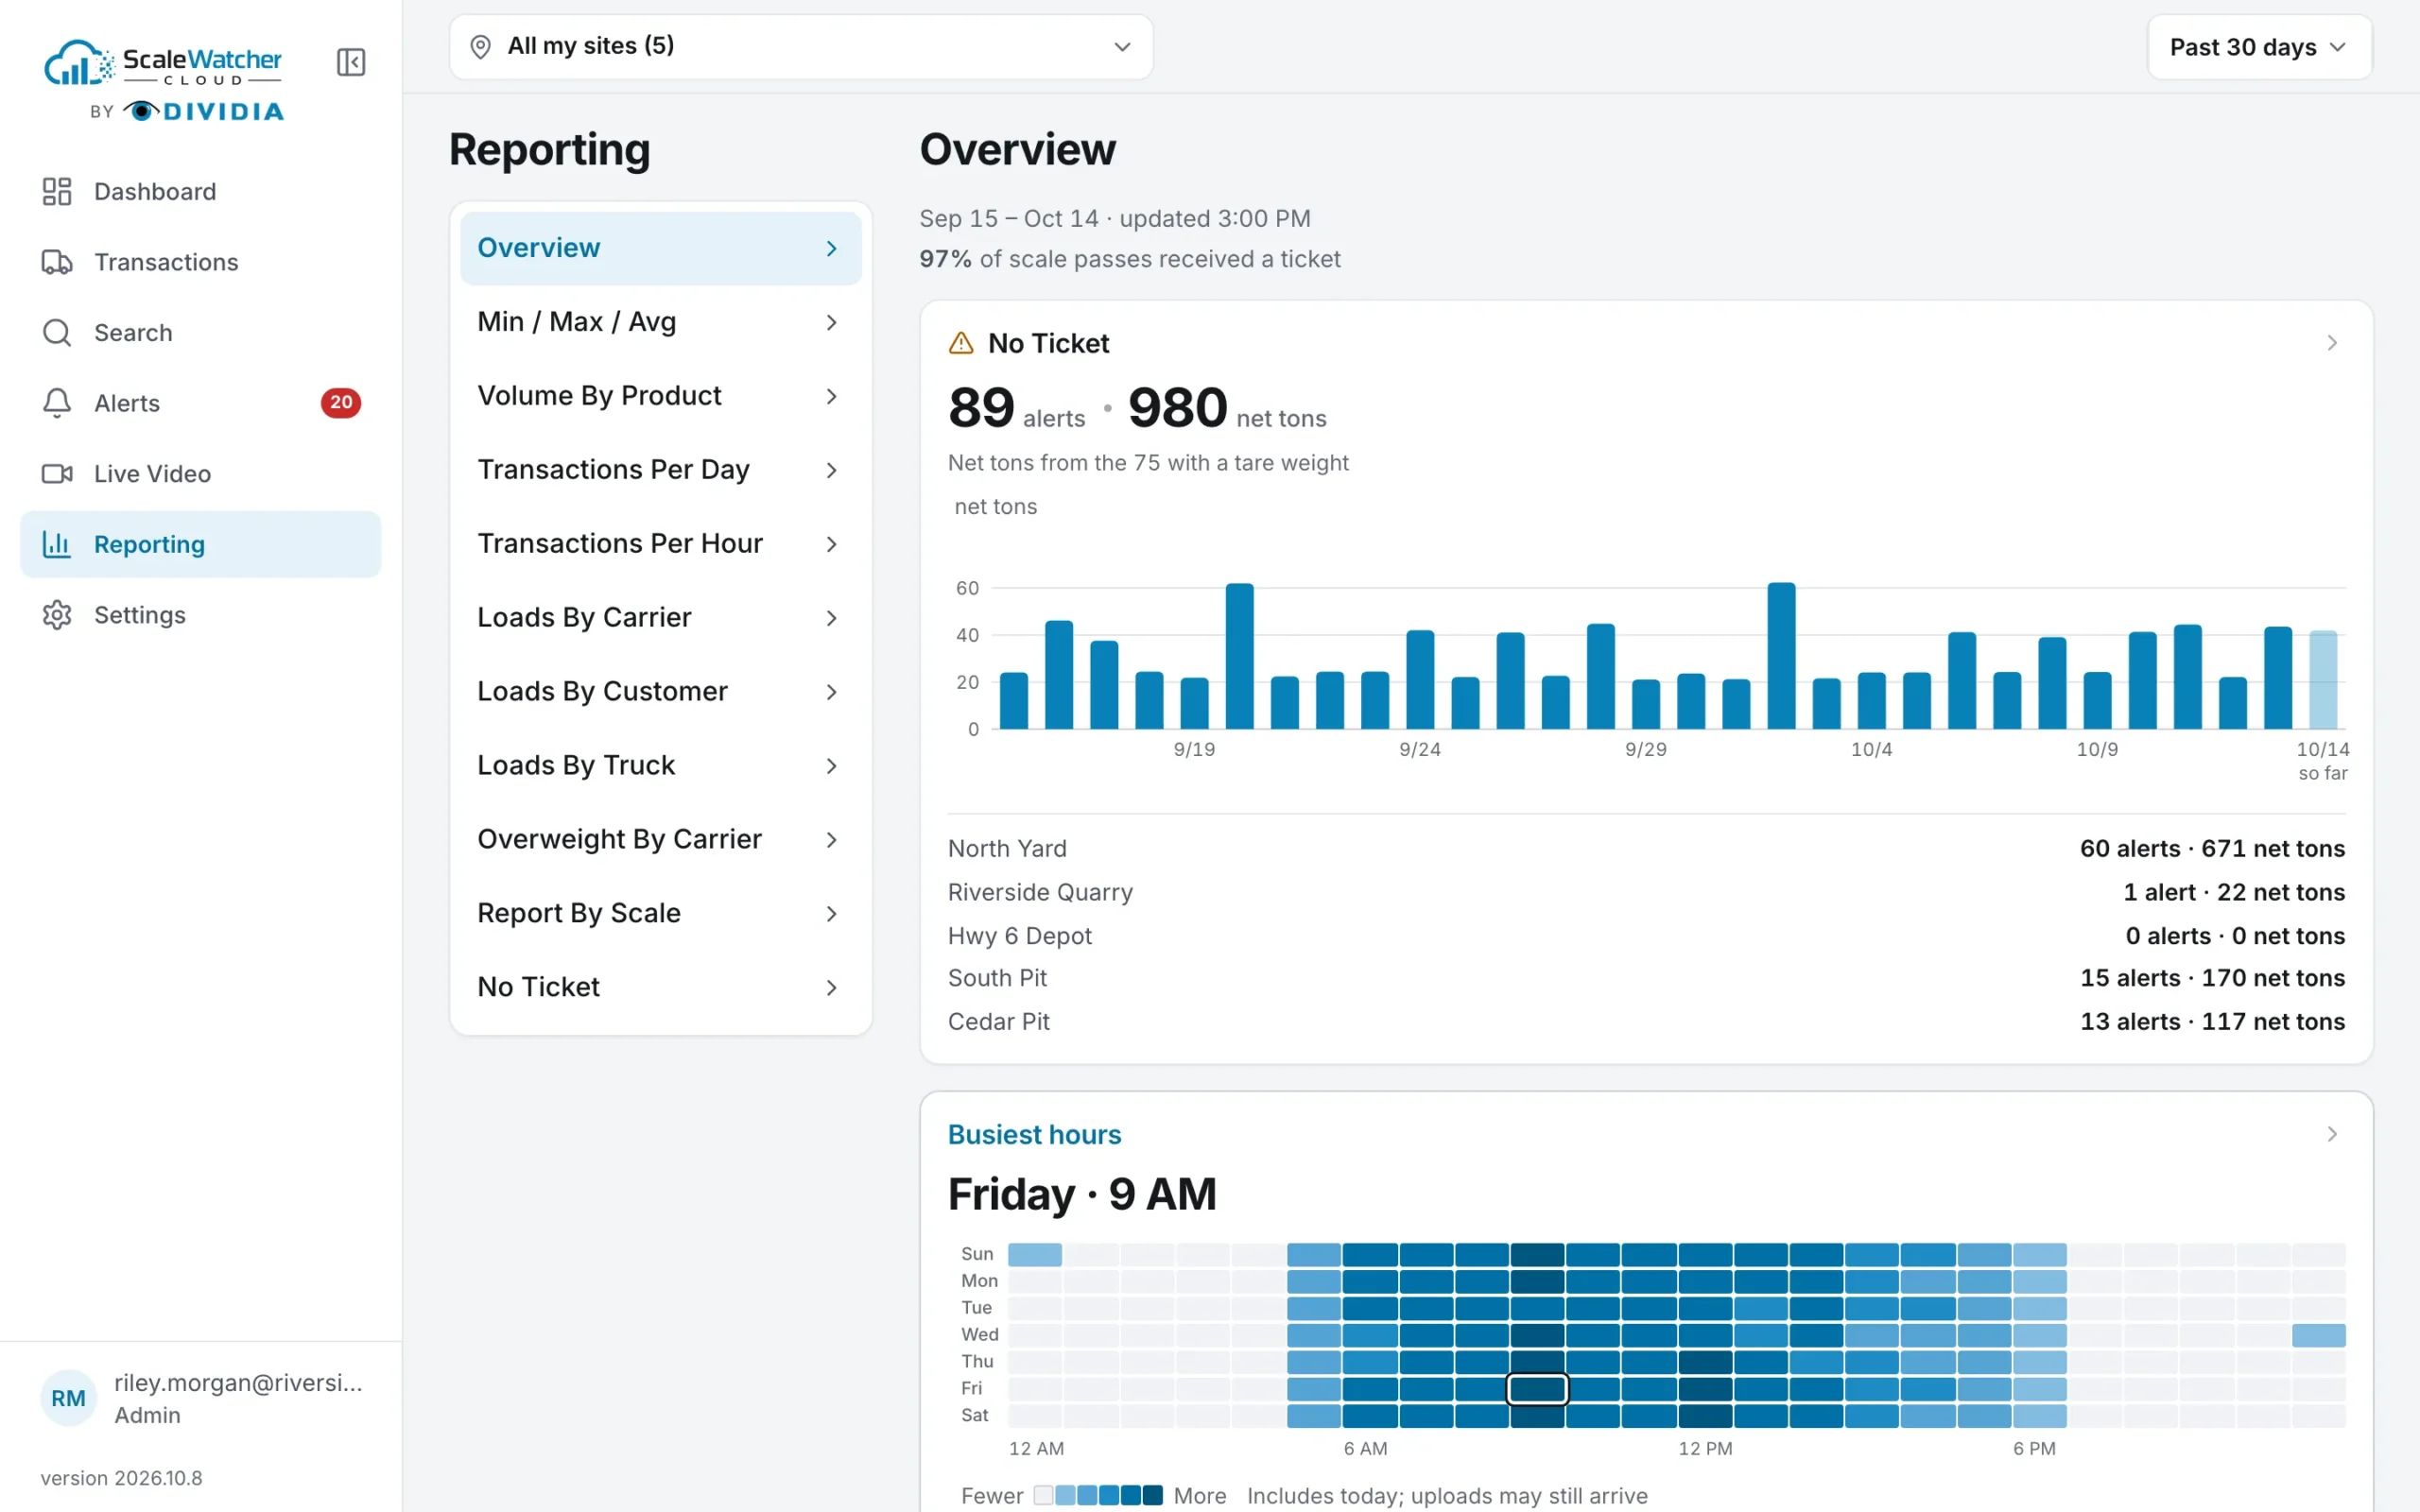
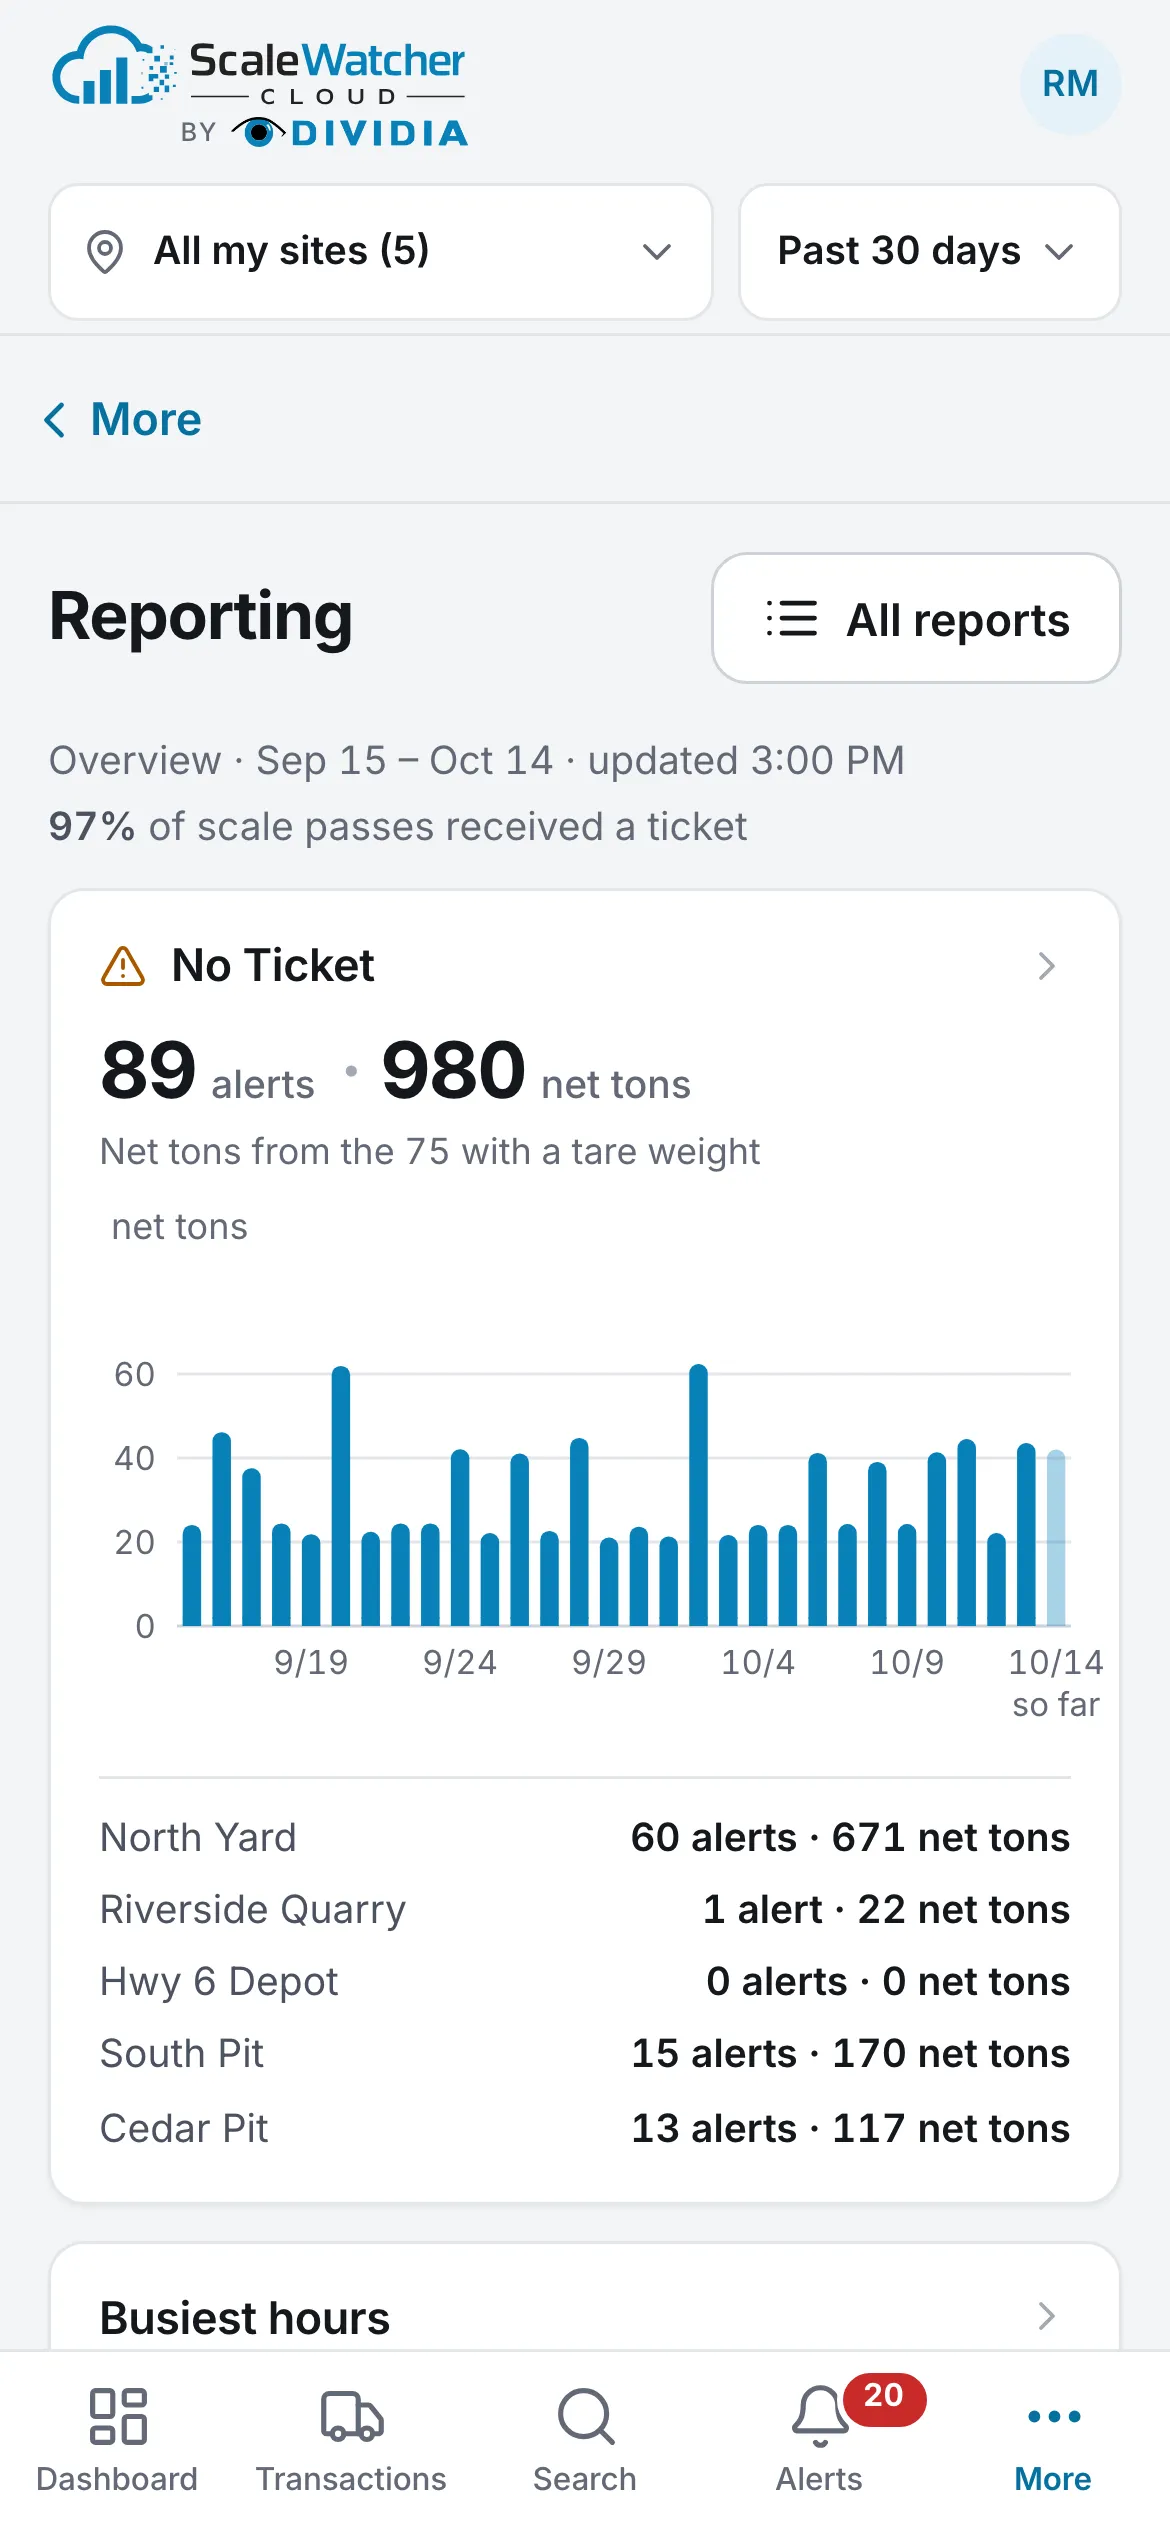
Reports for the sites and date range in the bar. Reporting opens on the Overview.
Overview
- No Ticket: the No Ticket alerts and their net tons.
- Busiest hours: tickets by weekday and hour: when the scale is busiest.
- Facility Time (facility sites): the median, the slowest 10%, and where the time goes.
- Volume By Product: tons per day, and the busiest day.
- Loads By Truck: loads per truck and the time between a truck’s loads.
Each card opens its report.
Reports
| Report | Answers |
|---|---|
| Min / Max / Avg | How long Facility Time, Wait Time and Load Time run, by day or hour, with the median and the slowest at every site; a day opens its transactions, longest first |
| Volume By Product | What moves, and how much, by date |
| Transactions Per Day | Volume by date or day of the week |
| Transactions Per Hour | When the scale is busiest |
| Loads By Carrier | Each carrier’s loads |
| Loads By Customer | Each customer’s loads |
| Loads By Truck | Loads per truck, and its turnaround |
| Overweight By Carrier | Which carrier overloads |
| Report By Scale | Each scale’s tickets, times, alerts and busiest hour; a scale opens its Min / Max / Avg |
| No Ticket | The No Ticket alerts and their net tons |
The range picker’s Hours row limits a report to part of the day (for example, 6 AM to 6 PM). Download saves a report as CSV or an Image (PNG), or prints it.
11. Settings
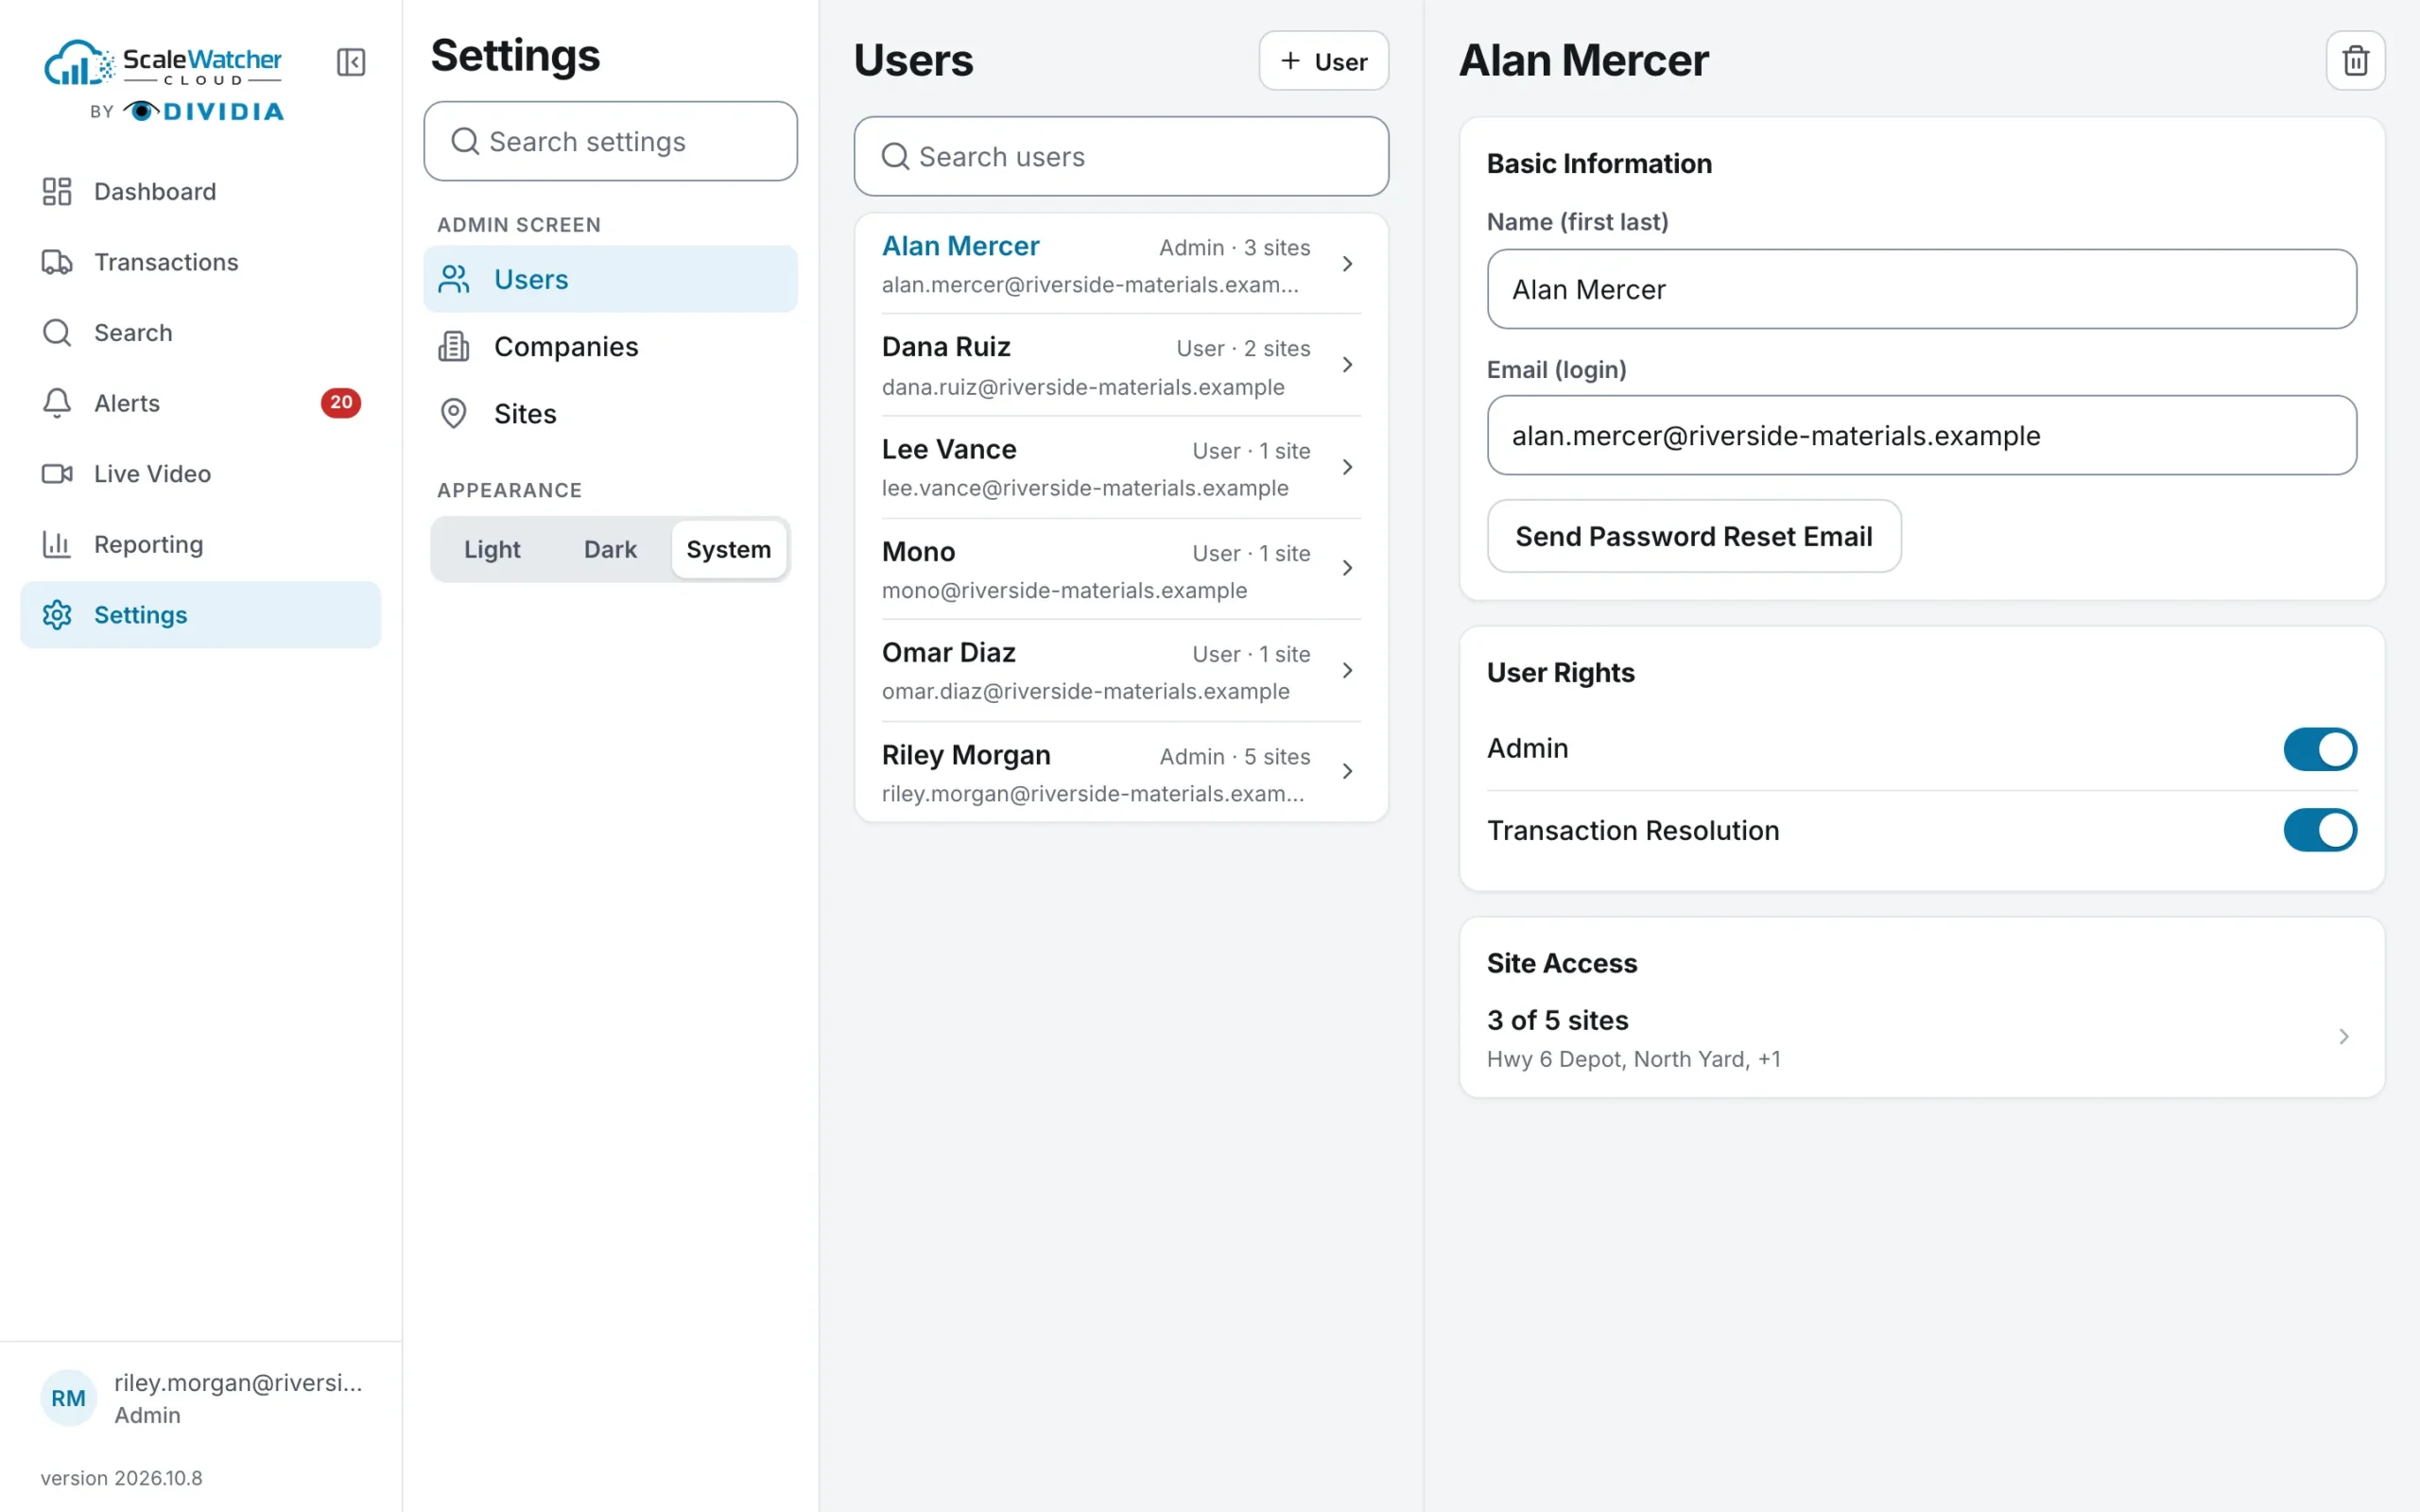
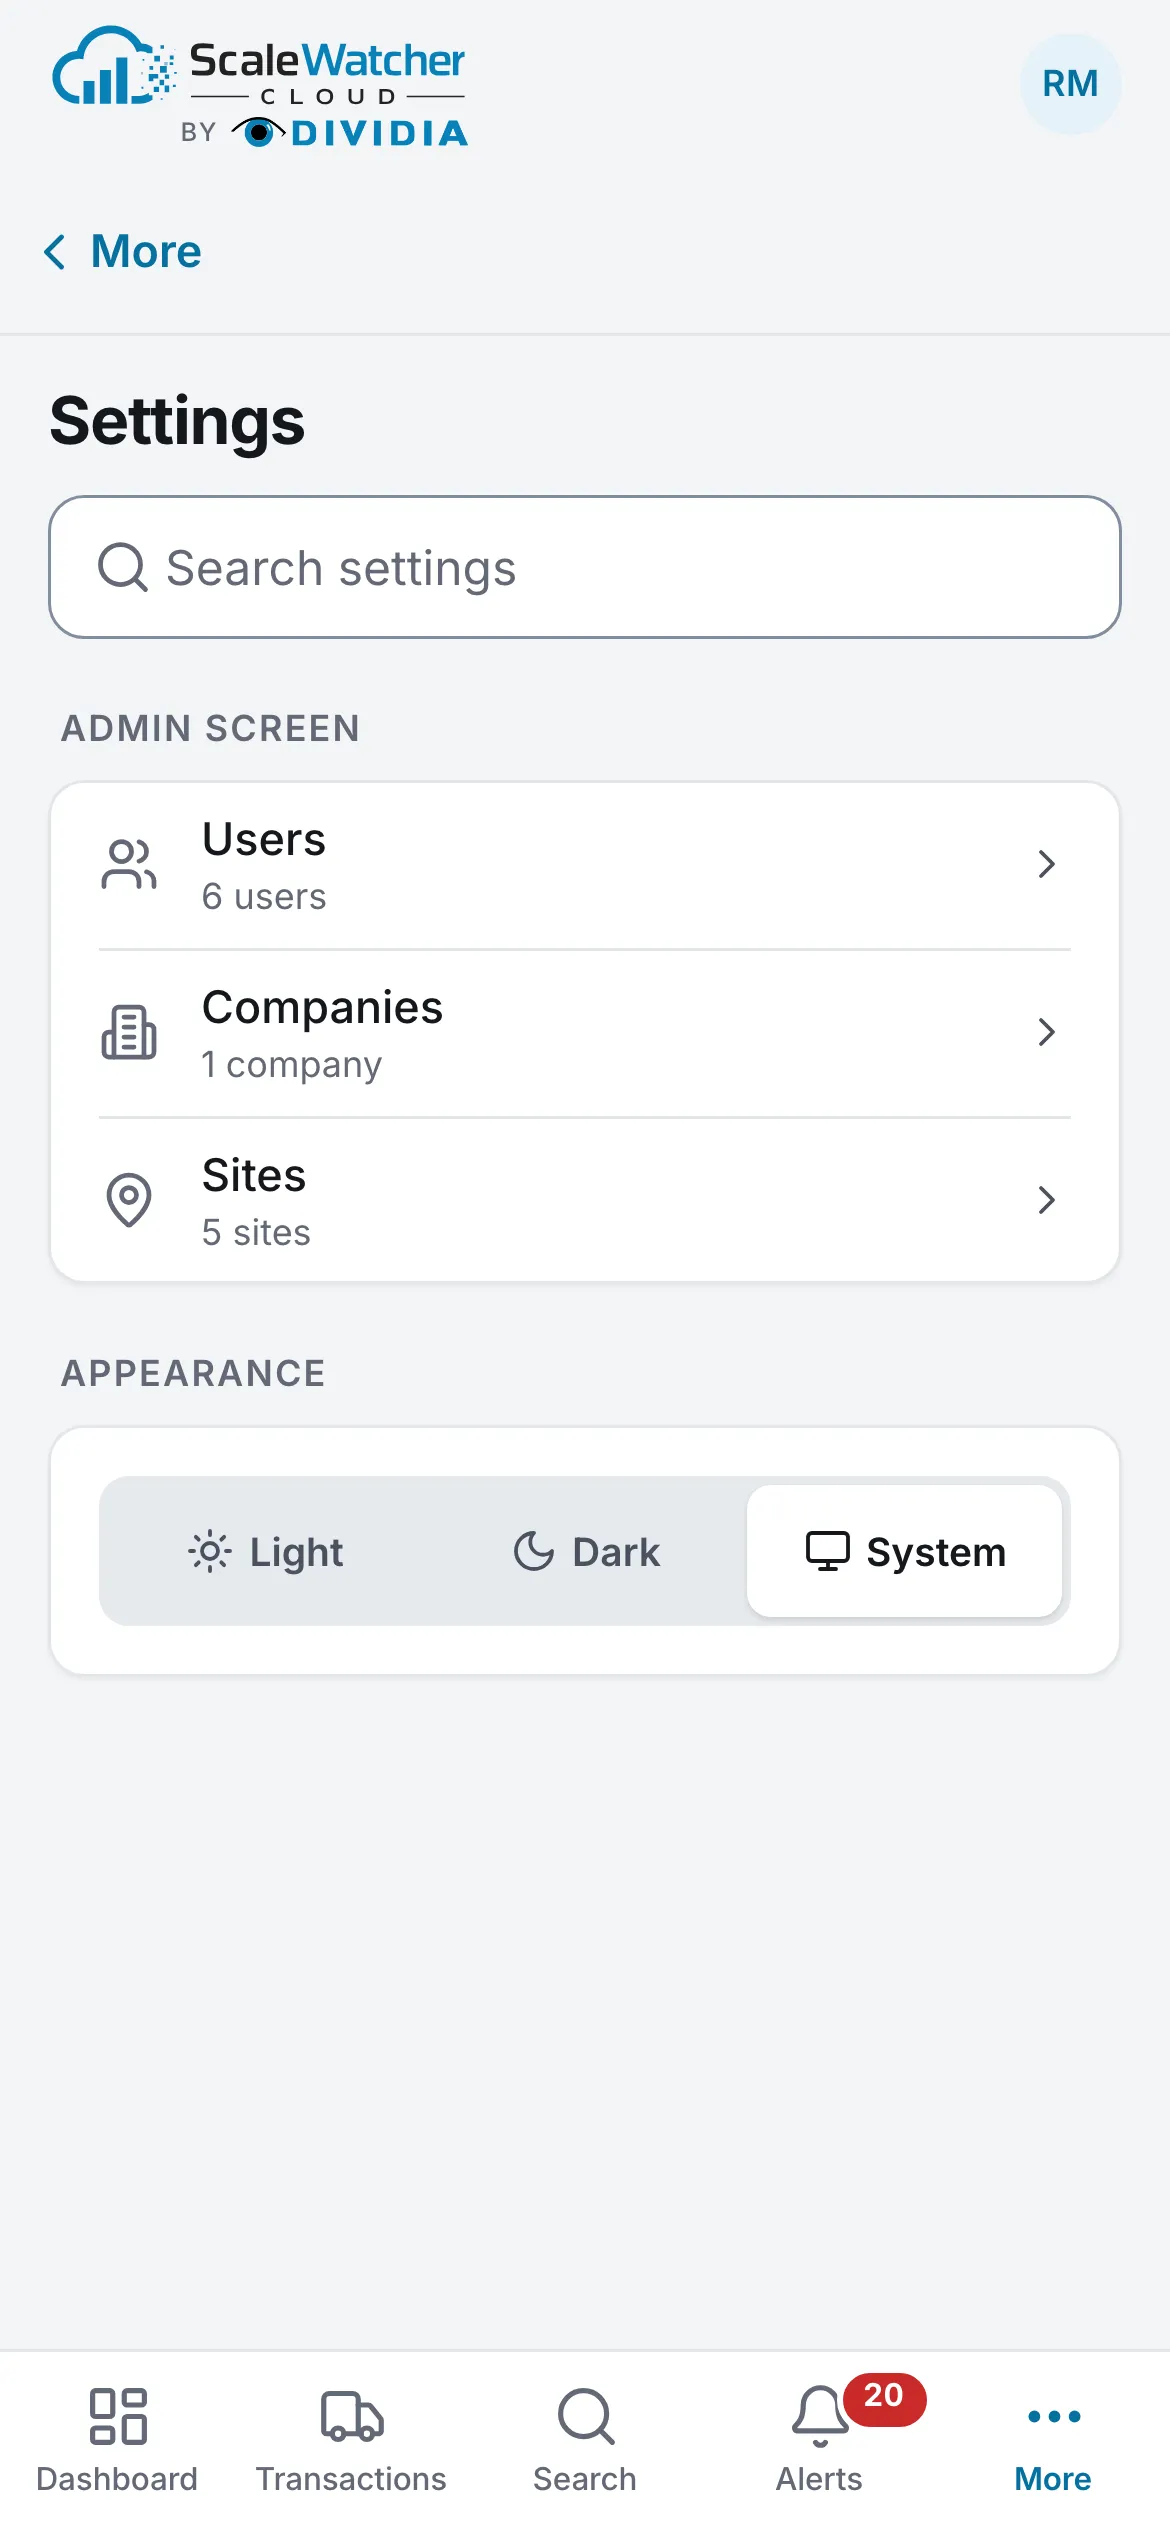
Appearance for everyone; users and sites for Admins.
- Appearance: Light, Dark or System.
- Users (Admins): add a person (New User), set their name and email, send their sign-in by email, give the Admin right and pick their Site Access. A person must have at least one site.
- Companies and Sites (Admins): rename them; on a site, turn on Require Comment on Alert Resolution. Other site details (serial number, tracking type, max transaction time) are shown read-only; Dividia sets them.
- Alert Configuration (Admins): pick who gets each alert type, by email or text.
Your own password and sites: Account, Change Password and My sites.
12. Reference
Events
| Event | Meaning |
|---|---|
| Facility In / Facility Out | The truck passed the entrance / exit camera |
| LPR Read | The plate was read at the scale |
| Truck On / Truck Leaving | The truck came onto / left the scale |
| Ticket Received / Ticket Printed | The ticket arrived from the ticketing system / was printed |
| Tare Ticket Received | A tare ticket arrived |
| Valve Opened / Valve Closed | A loading valve opened / closed |
Alerts
| Alert | Meaning |
|---|---|
| No Ticket | A truck crossed the scale and no ticket came in |
| Overweight | The max weight is over the site’s limit |
| Weight Mismatch | The ticket’s gross weight does not match the scale’s |
| Tare Contamination | The truck’s weight before loading is too high (possible material already on it) |
| Valve Alert | A loading valve closed without a ticket being printed |
| Manual Ticket | A ticket was entered by hand, not from the scale system |
| Waste Ticket | A waste material ticket was issued |
| Scale Connection | The scale’s link to the NVR was lost or restored |
| Scale Data Fail / Valve Data Fail | The scale’s / valve’s data was not captured for the transaction |
Alert statuses
| Status | Meaning |
|---|---|
| New | Nobody has picked it up |
| Assigned | Someone owns it |
| In Progress | Being looked into |
| Possible Theft | Set by the owner or an Admin |
| Confirmed Theft | Admins only |
| Resolved | Closed as No issue or Issue found |
Times
| Time | Measured |
|---|---|
| Facility Time | From Facility In to Facility Out |
| Wait Time | From Facility In to the LPR Read on the scale |
| Load Time | The truck’s time at the scale, from its first scale event to its last |
Questions: Dividia, (866) 348-4342, sales@dividia.net.
13. Questions and answers
- What do I need at a site?
- The ScaleWatcher device (a Dividia NVR or Cloud NVR), cameras at the scale, and cameras at the entrance and exit for Facility Time. The scale’s data and the ticket go to the device.
- Is there anything to install?
- No. ScaleWatcher Cloud runs in the browser on any phone, tablet or computer. On a phone or tablet, add it to the home screen to open it like an app.
- How current is the data?
- The device sends each transaction, with any alert on it, when the truck’s visit is complete.
- What if a plate is not read?
- The truck is still recorded from the scale and the ticket. At facility sites, Unmatched Tickets lists the tickets still waiting for their visit.
- How good is the plate reading?
- Most plates that are clear in the image are read. A bent, dirty or missing plate may not be; the truck is still recorded from the scale and the ticket.
- Why does one visit show more than one scale transaction?
- A truck can cross the scale more than once in a visit, for example a tare pass and then a loaded pass. The license plate ties them to the same visit.
- Who sees what?
- Each person sees only the sites they are given, as an Admin, User or View only (Your access).
- Which alerts will my sites have?
- It depends on each site’s equipment, setup and license: No Ticket, Overweight, Weight Mismatch and the equipment alerts (Reference).
- Is a No Ticket alert proof of theft?
- No. It is a question to answer. Mark it Possible Theft while it is checked; only Admins set Confirmed Theft.
- Can I get alerts by email or text message?
- Yes. An Admin picks who gets each alert type, by email or text, in Alert Configuration.
- Can I export my data?
- Search results download as CSV, reports as CSV or an image, and each transaction as a PDF record.
- Can I get my data into my own tools?
- Yes, with the ScaleWatcher API: transactions, events, alerts, ticket PDFs and metrics, as JSON for the BI and dashboard tools you already use. Dividia turns on API access for your account; the reference is at dividia.net/api.
- What about video?
- Live Video shows the site’s cameras, for people with the Live Video right. A transaction can also carry optional short video clips of its events. More video in the app, including playback of an event in the recorded video, is in active development.
- What does the device need on our network?
- Outbound connections only, over HTTPS; ScaleWatcher needs no inbound ports. Viewing an older NVR’s Live Video from off site needs the NVR’s ports forwarded or a VPN. Ask Dividia for the network requirements sheet for your IT team.
- Is Classic still available?
- Yes, as Classic on tablets and desktops, with the same data.